Download

1 / 26
260 likes | 274 Vues
Coastal Ocean Modeling, Observation and Prediction in the Mid-Atlantic Bight. John Wilkin, Hernan Arango, John Evans Naomi Fleming, Gregg Foti, Julia Levin, Javier Zavala-Garay, Gordon Zhang Regional Ocean Prediction Scott Glenn, Oscar Schofield, Bob Chant Josh Kohut, Hugh Roarty, Josh Graver

E N D
Coastal Ocean Modeling, Observation and Prediction in the Mid-Atlantic Bight John Wilkin, Hernan Arango, John Evans Naomi Fleming, Gregg Foti, Julia Levin, Javier Zavala-Garay, Gordon Zhang Regional Ocean Prediction Scott Glenn, Oscar Schofield, Bob Chant Josh Kohut, Hugh Roarty, Josh Graver Coastal Ocean Observation Lab Janice McDonnell Education and Outreach Regional Ocean Prediction http://marine.rutgers.edu/po Coastal Ocean Observation Lab http://marine.rutgers.edu/cool Education & Outreach http://coolclassroom.org Coastal Observation and Prediction Sponsors:
Real-time data and analysis to ships via ExView and HiSeasNet • glider, CODAR, satellite, WRF Daily Bulletin • NCOM and ROMS/assimilation 2-day forecasts Integrating Ocean Observing and Modeling Systems for SW06 Analysis and Forecasting Coastal Ocean Observation Labhttp://marine.rutgers.edu/cool/sw06/sw06.htm Regional Ocean Modeling and Predictionhttp://marine.rutgers.edu/po/sw06 • ROMS model embedded in NCOM or climatology • WRF and NCEP forcing + rivers • 2-day cycle IS4DVAR assimilation • gliders and CODAR • satellite SST, bio-optics • high-res regional WRF atmospheric forecast • SW06 ship-based obs. • Model-based re-analysis of submesoscale ocean state • ROMS/IS4DVAR assimilation: plus CODAR, Scanfish, moorings, CTDs … • high-res nesting in SW06 center • ensemble simulations; uncertainty instability, sensitivity analysis, optimal observations
62/62: 62 moorings deployed and recovered
IS4DVAR assimilation • SW06: Shallow Water Acoustics 2006: • ROMS model configuration • Assimilation data, IS4DVAR configuration, real-time performance • Issues: • initialization, boundary conditions / nesting, background error covariance scales, unconstrained shelf/slope front transport • Next steps: • SW06 reanalysis • algorithmic tuning, more data, higher resolution, nesting • ensemble simulations • forecast and analysis uncertainty and predictability • observing system design
xb= model state at end of previous cycle, and 1st guess for the next forecast In 4D-VAR assimilation the adjoint model computes the sensitivity of the initial conditions to mis-matches between model and data A descent algorithm uses this sensitivity to iteratively update the initial conditions, xa, to minimize Jb+ S(Jo) 0 1 2 3 4 time Observations minus Previous Forecast Adjoint model integration is forced by the model-data error dx
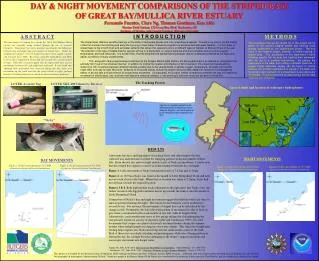
Adjoint surface temperature states at different time during a three - day period. Initial adjoint forcing area is surrounded by the black frame. Top: southward wind. Bottom: northward wind.
The Devil is in the Details Basic IS4DVAR* procedure*Incremental Strong Constraint 4-Dimensional Variational Assimilation • Choose an • Integrate NLROMS and save (a) Choose a (b) Integrate TLROMS and compute J (c) Integrate ADROMS to yield (d) Compute (e) Use a descent algorithm to determine a “down gradient” correction to that will yield a smaller value of J (f) Back to (b) until converged (3) Compute new and back to (2) until converged
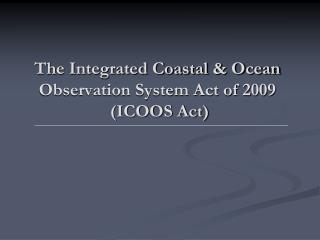
SW06 Model Domains ROMS LATTE outer boundary ROMS SW06 outer boundary Harvard Box (100kmx100km)
ROMS SW06 • 5-km grid (coarse) for IS4DVAR testing • Forcing: • NCEP-NAM and WRF USGS Hudson River OTPS tides • Open boundaries NCOM and L&G climatology • 2-day assimilation cycle • length scales for background error covariance: • 20-km horizontal 5-m vertical • Data: • gliders, CTDs, Scanfish, XBTs, ship thermo-salinograph, daily best-SST composite, AVISO SSH
ROMS SW06 real-time observations SW06 ExView Google Earth movie
Salt 5m Salt 30m Temp 30m
Forecast Skill Observations: Glider data Lag=0: Comparison with data used for assimilation Lag=2: Comparison of 2 day forecast with data Lag=8 Comparison of 8 day “forecast” with data
Distribution of errors in forecast for lag = 2 daysat day 215 Day = 215
IS4DVAR for initial conditions estimation • SW06 initial conditions (climatology) were clearly biased in summer 2006 • extreme Hudson discharge in July • Assume early glider observations are indicative of shelf-wide conditions • make an implicit long length scale correlation assumption • Introduce ‘bogus’ data to assimilation data set
Now what ? SW06 reanalysis of sub-mesoscale ocean state • IS4DVAR algorithmic tuning • forecast cycle length; background error covariance • More data • CODAR, moorings (u,T,S), shipboard ADCP, drifters … • Higher resolution / nesting • Ensemble simulations • forecast skill; quantify predictability; analysis uncertainty Mid-Atlantic Bight wide COMOP • Address open boundary and nesting issues • Deep ocean / shelf sea coupling • Observing system design • Physics information in the transport of optics fields
SST Mixing of the Hudson and Raritan Rivers Visible RGB Detritus Absorption PhytoplanktonAbsorption SeaWiFS chlorophyll