Desktop Weather-Forecast System
380 likes | 406 Vues
The Desktop Weather-Forecast system allows easy access to real-time initial and boundary conditions data, enabling real-time weather forecasts, regional climate analysis, and meteorological education and training. It comes with a user-friendly interface, automated access to global NWP model output, and a powerful desktop display program to visualize forecast results.

Desktop Weather-Forecast System
E N D
Presentation Transcript
Desktop Weather-Forecast System Jim Kinter, Mike Fennessy, Brian Doty and J. Shukla Center for Ocean-Land-Atmosphere Studies
Desktop Weather-Forecast System Acknowledgements NOAA/NWS/NCEP Environmental Modeling Center – data sets, Eta model Fedor Mesinger (NCEP/EMC) – Eta model Dusan Jovic (ICTP) – Desktop version of Eta model Oreste Reale (COLA) – Processing/display of Eta model output Lennart Bengtsson (MPI) – Discussions and encouragement Brian Doty (COLA) – COLA server development and data Joe Wielgosz (COLA) – COLA server development Curt Steinmetz (COLA) – Linux installation and support Jennifer Adams (COLA) – GrADS script development and support Tom Wakefield (COLA) – PC support
NCEP Global Weather Forecasts Desktop Weather Forecasting NCEP COLA Global Weather Forecasts GrADS-DODS Server Region-Specific Lateral BCs WWW PC-Based Regional NWP
Desktop Weather-Forecast System Enables real-time weather forecasts, regional climate analysis and meteorological education and training through: • Easy access to real-time initial and boundary conditions data • Easy configuration of regional NWP model for any locality in the world • Readily available, low-cost personal computing hardware/software • Moderate speed Internet connection
Desktop Weather-Forecast System • Ease of use: • Point and click interface to set up region the first time • Automated access to NOAA/NWS/NCEP global NWP model output for • Atmospheric initial conditions • Initial soil wetness, snow • Surface boundary conditions (SST, sea ice) and lateral boundary conditions (circulation) • Automated linkage to powerful desktop display program to see results of forecast • Full documentation for getting data, running forecast • Demonstrated live in March 2001 at International Monsoon Conference in New Delhi
Desktop Weather-Forecast System • Elements: • Desktop or laptop PC running Linux w/Fortran compiler • Moderate speed Internet connection • Grid Analysis and Display System (GrADS) for data acquisition and display • GrADS-DODS server providing real-time global weather observations and forecast data • Regional NWP model, e.g., desktop version of NCEP Meso model, that uses real topography, soil and vegetation data
Desktop Weather-Forecast System • Elements: • Desktop or laptop PC running Linux w/Fortran compiler • Moderate speed Internet connection • Grid Analysis and Display System (GrADS) for data acquisition and display • GrADS-DODS server providing real-time global weather observations and forecast data • Regional NWP model, e.g., desktop version of NCEP Meso model, that uses real topography, soil and vegetation data
Desktop Weather-Forecast System • Elements: • Desktop or laptop PC running Linux w/Fortran compiler • Moderate speed Internet connection • Grid Analysis and Display System (GrADS) for data acquisition and display • GrADS-DODS server providing real-time global weather observations and forecast data • Regional NWP model, e.g., desktop version of NCEP Meso model, that uses real topography, soil and vegetation data
GrADS and DODS Data Interoperability Distributed Data Distributed Analysis
GrADS-DODS Server (GDS) GrADS Joe Wielgosz, Brian Doty, James Gallagher, Daniel Halloway Jennifer Adams, Reinhard Budich, Luigi Calori, Brian Doty, Wesley Ebisuzaki, Mike Fiorino, Tom Holt, Don Hooper, Jim Kinter, Steve Lord, Gary Love, Karin Meier, Matt Munnich, Uwe Schulzweida, Arlindo da Silva, Michael Timlin, Pedro Tsai, Brian Wilkinson, Katja Winger
Information Technology: GrADS Visualizing Maps, Charts, Animations Interactive Quantitative INTEGRATED USER INTERFACE Analyzing Accessing, Subsetting 4D Grids In Situ Obs Images { Expressions, Functions of Original Variables General slices of User Definable, Extensible Arbitrary Domains Optimized for Typical Queries
GrADS Usage • “Natural” user interface for scientific computations, and graphical production • Used at over 100 laboratories worldwide • Used by over 1000 scientists worldwide • E.g., J. Climate - Over ½ of all figures (and computations?) produced using GrADS • Handles GRIB, binary (model output) formats in “native” mode • Widely used for analysis and display of data from the National Weather Service, other WMO sources
GrADS Analysis Model • ENABLES VERY SOPHISTICATED ANALYSIS TASKS • IN A HIGHLY ENCAPSULATED WAY • Scientists only need to specify: • dimension constraint • list of data sets • GrADS expression • This unique, innovative approach to geophysical data analysis is the major reason for GrADS’ popularity.
internet Client GrADS Matlab DODS client libraries IDL data appears to client as local file, in a standard format (i.e, NetCDF, etc.) etc.. GrADS-DODS Analysis Server Server datasets in any format supported by GrADS performs analysis operations manages sessions, translates dataset names supports extended request types for analysis, upload GrADS data GRIB data GrADS batch mode interface code DODS server libraries Java servlet NetCDF data etc.. Result cache holds temporary data (uploaded, generated by a previous operation, or transferred directly from another server) for use in remote analysis DODS data and requests EncapsulatedAnalysis Requests Joe Wielgosz: 5/25/00
Summary: GrADS-DODS Server • Share data: Enterprise-wide; Internet-wide --- data-format independent • Data interoperability: Consistent metadata for many data types • Distributed analysis: Reduces network load; improves interactivity • Automation of analysis techniques: Analysis techniques can be captured in the form of scripts and provided on server and/or client
Desktop Weather-Forecast System • Elements: • Desktop or laptop PC running Linux w/Fortran compiler • Moderate speed Internet connection • Grid Analysis and Display System (GrADS) for data acquisition and display • GrADS-DODS server providing real-time global weather observations and forecast data • Regional NWP model, e.g., desktop version of NCEP Meso model, that uses real topography, soil and vegetation data
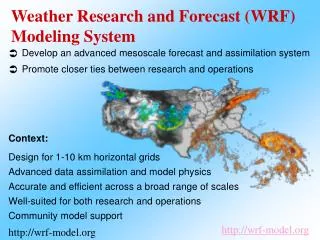
NCEP/EMC Eta Model • Limited-area Mesoscale Model • Full Primitive Equations • Eta Vertical Coordinate • Step-like Treatment of Orography • Sub-Grid Scale Physics • Deep and Shallow Convection • Radiation • Turbulence • Cloud Liquid Water
Eta-25 Eta-25 Eta-25 22 July 2002 23 July 2002 24 July 2002 SSM/I SSM/I SSM/I
Running the Desktop Weather Forecast System • Interactive – First time for a new domain • Select the domain • Select grid resolution • Check grid visually • Select starting date, time, length of forecast • Forecast starts automatically • When forecast complete, view forecast weather maps • Routine operation • Set starting date, time and length in run script • Run forecast and view forecast weather maps
Running the Desktop Weather Forecast System • Interactive – First time for a new domain • Select the domain • Select grid resolution • Check grid visually • Select starting date, time, length of forecast • Forecast starts automatically • When forecast complete, view forecast weather maps • Routine operation • Set starting date, time and length in run script • Run forecast and view forecast weather maps
Running the Desktop Weather Forecast System • Interactive – First time for a new domain • Select the domain • Select grid resolution • Check grid visually • Select starting date, time, length of forecast • Forecast starts automatically • When forecast complete, view forecast weather maps • Routine operation • Set starting date, time and length in run script • Run forecast and view forecast weather maps
Specify grid resolution 15 km 40 km 20 km 50 km 25 km 80 km
Running the Desktop Weather Forecast System • Interactive – First time for a new domain • Select the domain • Select grid resolution • Check grid visually • Select starting date, time, length of forecast • Forecast starts automatically • When forecast complete, view forecast weather maps • Routine operation • Set starting date, time and length in run script • Run forecast and view forecast weather maps
Yes No
Running the Desktop Weather Forecast System • Interactive – First time for a new domain • Select the domain • Select grid resolution • Check grid visually • Select starting date, time, length of forecast • Forecast starts automatically • When forecast complete, view forecast weather maps • Routine operation • Set starting date, time and length in run script • Run forecast and view forecast weather maps
Specify month of initial time Jan Apr Jul Oct Feb May Aug Nov Mar Jun Sep Dec
Specify day of initial time 1 6 11 16 21 26 2 7 12 17 22 27 3 8 13 18 23 28 4 9 14 19 24 29 5 10 15 20 25 30 31
00Z 06Z 12Z 18Z Specify hour of initial time
Specify length of forecast 6 hrs 24 hrs 36 hrs 48 hrs 72 hrs
Running the Desktop Weather Forecast System • Interactive – First time for a new domain • Select the domain • Select grid resolution • Check grid visually • Select starting date, time, length of forecast • Forecast starts automatically • When forecast complete, view forecast weather maps • Routine operation • Set starting date, time and length in run script • Run forecast and view forecast weather maps
******************************************************************************************************************************** *** A forecast for ‘INDI' will now be started *** *** *** *** With center lon, lat: 81E, 17N *** *** Width in longitude: 46 *** *** Width in latitude: 37 *** *** *** *** At resolution = 80 km *** *** *** *** Starting from 12Z03SEP2002 *** *** for 72 hours *** ****************************************************************
Running the Desktop Weather Forecast System • Interactive – First time for a new domain • Select the domain • Select grid resolution • Check grid visually • Select starting date, time, length of forecast • Forecast starts automatically • When forecast complete, view forecast weather maps • Routine operation • Set starting date, time and length in run script • Run forecast and view forecast weather maps
Running the Desktop Weather Forecast System • Interactive – First time for a new domain • Select the domain • Select grid resolution • Check grid visually • Select starting date, time, length of forecast • Forecast starts automatically • When forecast complete, view forecast weather maps • Routine operation • Set starting date, time and length in run script • Run forecast and view forecast weather maps