Download
1 / 49
490 likes | 516 Vues
This lecture discusses the process of signal transduction and its simulation in bioinformatics, including growth factor and receptor signaling, construction of pathway models, and the use of signaling oncogenes and therapeutics.

E N D
Advanced Bioinformatics Lecture 5: Signal transduction and simulation ZHU FENG zhufeng@cqu.edu.cn http://idrb.cqu.edu.cn/ Innovative Drug Research Centre in CQU 创新药物研究与生物信息学实验室
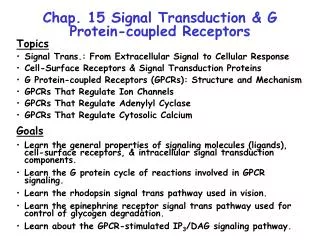
Table of Content Components in signal transduction Growth factor and receptor RTK signal transduction Constructing a pathway model Signaling oncogene & therapeutics 2
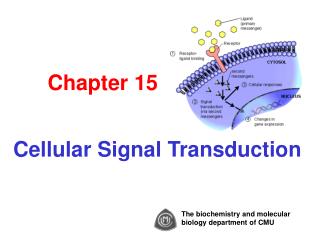
What is signal transduction? Signal Transduction is the process by which a cell converts an extracellular signal into a response. Involved in: (1) Cell-cell communication; (2) Cell’s response to environment; (3) Intracellular homeostatsis – internal communication. 3
Generic Signal Transduction Signal Sensor Metabolism Migration Survival … Transduction cascade 4
What is the signal? • External message to the cell • Peptides / Proteins - Growth Factors • Amino acid derivatives - epinephrine, histamine • Other small biomolecules - ATP • Steroids, prostaglandins • Gases - Nitric Oxide (NO) • Photons • Damaged DNA • Odorants, tastants • Signal = LIGAND: (a molecule that binds to a specific site on another molecule, usually a protein, ie. receptor) 5
What is the receptor? Sensors, what the signal/ligand binds to initiate ST Hydrophillic Ligand Cell-Surface Receptor Plasma membrane Hydrophobic Ligand Carrier Protein Intracellular Receptor Nucleus Alberts et al. Adapted from Molecular Biology of the Cell, 4th edition, 2002. 6
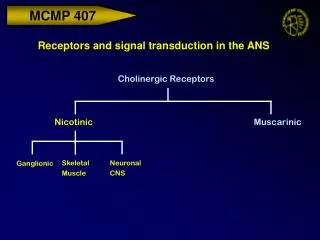
Cell surface receptor types Ligand-gated ion channel (1) ACh binding; (2) Gate open; (3) Ion pass & membrane depolarization; (4) ACh reduces in concentration; (5) Gate close and desensitization. 7
Cell surface receptor types G-protein coupled receptor (GPCR) Effectors Cellular responses (1) Ligand-binding; (2) Receptor conformation change; (3) G protein binding and activation (GTP to GDP); (4) Activated G-protein binds to effectors and trigger further cellular response. 8
Cell surface receptor types Receptor tyrosine kinase (1) Signal binds to activated receptor dimer; (2) Adaptors with SH2 domain bind specifically to each phosphorylated tyrosine (PT) on receptor dimer; (3) Unique cellular response for each Adaptor-PT. 9
Growth factor & receptor • Ligands binding enzyme linked receptors; signaling diverse cellular responses including: • Proliferation • Differentiation • Growth • Survival • Angiogenesis • Capable of sending signal to multiple cell types or be specific 10
RTK signal transduction Dimerization & activation of EGFR SH2 domains 14
Signaling pathways activated by RTKs MAPK Apoptosis & metabolic processes Multiple cytoplasmic targets 15
Signal activation by RTKs via membrane translocation Activation of PKB (Akt): (1) PIP3 serves as a binding site for PH domains of PDK1 and PKB leading to activation of PDK1 and PKB activities; (2) Full activation of PKB requires phosphorylation by PDK1. (3) Activated PKB prevents apoptosis and regulates various metabolic processes. 16
Signal activation by RTKs via conformation changes Binding of the SH2 domains of p85, the regulatory subunit of PI-3 kinase to pTyr sites on activated receptors releases an autoinhibitory constraint that stimulates the catalytic domain (p110). PI-3 kinase catalyzes the phosphorylation of the 39 positions of the inositol ring of PtdIns(4)P and PtdIns(4,5)P2 to generate PtdIns(3,4)P2 and PtdIns(3,4,5)P3, respectively. 17
Signal activation by RTKs via tyrosine phosphorylation Binding of the SH2 domains of PLC gamma to pTyr sites in activated receptors facilitates tyrosine phosphorylation of PLC gamma as well as membrane translocation. Tyrosine phosphorylation is essential for PLC gamma activation leading to hydrolysis of PtdIns(4,5)P2 and generation of the two second messengers Ins(1,4,5)P3 and diacyglycosol. 18
Mechanisms for amplifying RTK activation FRS2α Gab1 (1) FGF receptor substrate-2 (FRS2α) forms a complex with activated FGF or NGF receptors via its phosphotyrosine-binding domain (PTB). (2) FGFR phosphorylates FRS2α on multiple tyrosines, and the resulting pTyr recruit Grb2 and Shp2, which bring Gab1 into the complex. (3) Gab1 is tyrosine phosphorylated and recruits PI-3K. (4) PI-3K initiates a positive feedback loop by generating PIP3, then recruiting more Gab1 and leading to further PI-3K activation. 19
Mechanisms for attenuating & terminating RTK activation (1) EGFR’s activity is attenuated by PKC at the membrane region and by PTP. (2) Mechanism for signal termination is via receptor endocytosis and degradation. (3) The RING finger domain of Cbl functions as a ubiquitin-ligase leading to receptor ubiquitination and degradation by proteosome. 20
Protein domains controlling RTK signaling Activated RTKs (1) SH2 and PTB bind to tyrosine phosphorylated sites in activated RTKs (2) PH binds to phosphoinositides (PIPs) leading to membrane association (3) SH3 and WW bind to proline-rich sequences in target proteins (4) PDZ binds to hydrophobic residues at the C-termini of target proteins (5) FYVE specifically binds to Pdtlns(3)P leading to membrane association Grb2 – SH3 – SH2 – SH3 – c-Src – SH3 – SH2 – Kinase – PI3-K – SH3 ––––– SH2 –– SH2 – PLC-γ –– PH –––– PLC –––– p – SH2 –– SH2 –– SH3 – H –– PLC –– SHP-2 – SH2 –– SH2 –––– PTPase –––– 21
Multiple domains of PLCγ cooperate to integrate multiple signals (1) SH2 forms complex of RTKs. (2) C2 and PH are in charge of PLCγ’s membrane association. (3) RTK-mediated tyrosine phosphorylation of PLCγ leads to intramolecular binding of the C-terminal SH2 domain to phosphotyrosine 783, stimulating enzymatic activity of PLCγ and then leading to hydrolysis of PIP2, and consequently leads to the formation of IP3 and DAG. 22
Activate MAPK pathway by RTKs Apoptosis Shape, migration Growth, differentiation, inflammation Tumor genesis 23
Constructing a pathway modelDynamic nature of biological networks More than a topological linkage of molecular networks. Pathway models can be based on network characteristics including those of invariant features. 24
Constructing a pathway modelDynamic nature of biological networks • Abstraction & Resolution • How much do we get into details? • What building blocks do we use to describe the network? 25
Constructing a pathway modelStep I – Definitions A simple imaginary metabolic network represented as a directed graph How do we define a biologically significant system boundary? Vertex (A, B, C): concentration of protein/substrate. Edge (b1, b2, b3): - flux (conversion mediated by proteins of one substrate into the other) Internal flux edge External flux edge 26
Constructing a pathway modelStep II – Interaction kinetics A simple imaginary metabolic network represented as a directed graph K P ATP ADP Enzyme + Substrate Kinase-ATP complex + inactive-enzyme ==> Kinase + ADP + active enzyme 27
Reversibility & equilibrium of chemical reactions H2 2H • Chemical reactions are reversible • Under certain conditions (concentration, temperature) both reactants and products exist together in equilibrium state 28
Reaction rates Net reaction rate = forward rate (consumption) – reverse rate (production) • In equilibrium: Net reaction rate = 0 • When reactants “just” brought together: Far from equilibrium, focus only on forward rate • But, same arguments apply to the reverse rate 29
The differential rate law How does the rate of the reaction depend on the concentration? e.g. m+n: Overall order of the reaction 3A + 2B C + D rate = k[A]m[B]n Stoichiometric coefficient Order of reaction with respect to A (Specific reaction) rate constant Order of reaction with respect to B 30
Rate constants and reaction orders • Each reaction is characterized by its own rate constant, depending on the nature of the reactants and the temperature • In general, the order with respect to each reagent must be found experimentally(not necessarily equal to stoichiometric coefficient) 31
Elementary processes and rate laws • Reaction mechanism: The collection of elementary processes by which an overall reaction occurs • The order of an elementary process is predictable 32
Elementary processes and rate laws • Reaction mechanism: The collection of elementary processes by which an overall reaction occurs • The order of an elementary process is predictable 33
Constructing a pathway modelStep III – Dynamic mass balance Concentration vector Stoichiometry Matrix Flux vector 34
Example and its time-dependent behavior Two genes and their products g1 g2 k1 P1 P2 Positive feedback loop k2 36
Example and its time-dependent behavior Two proteins react and have negative feedback on g1 transcription g1 g2 k1 P1 P2 k2 k3 P1P2 37
Example and its time-dependent behavior The reaction product has also a positive feedback on g2 transcription g1 g2 k1 P1 P2 k2 k3 k4 P1P2 38
Growth factor ST and cancer Growth signal autonomy, insensitivity to anti-growth signals, resistance to apoptosis, uncouple cell’s growth program from signals in the environment. Growth factors in normal cells serve as environmental signals. Hanahan and Weinberg, Hallmarks of Cancer, Cell (100) 57, 2000. Growth factors regulate growth, proliferation, and survival. These are all deregulated in cancer. 39
GF receptors with oncogenic potential EGFR, kinase activity stimulated by EGF-1 and TGF-a involved in cell growth and differentiation, was linked via sequence homology to a known avian erythroblastosis virus onocgene, v-erbB. Since then, many oncogenes have been shown to encode for GFRs. EGFR family Insulin Receptor family erbB1 (c-erbB) IGF-1 (c-ros) erbB2 (neu) Neurotrophins FGF Family NGFR (trk) FGFR-1(fig) BDNFR (trk-B) FGFR-2(K-sam) NT3 R (trk-C) PDGFR Family CSF-1R (c-fms) SLF R (c-kit) 40
GF receptors with oncogenic potential PDGF, originally shown to regulate proliferation, was also shown to have homology to v-sis, the simian sarcoma virus. Other viral oncogenes encoded protein products that were growth factors that often over-expressed in cancer such as TGF-a. Autocrine signalling leads to deregulated growth. PDGF family Neurotrophins A chain NGF B chain (c-sis) BDNF FGF Family NT3 acidic FGF Cytokines (Hematopoietic) basic FGF IL-2 EGF Family IL-3 EGF M-CSF TGF-a GM-CSF 41
Function of (mutated) Ras in cancer Cancer 46
ST intermediates can be targets for anti-cancer drugs 48