Download
1 / 26
500 likes | 1.19k Vues
Introduction to the USEPA’s Storm Water Management Model (SWMM 5.0). David Rosenberg CEE 5460 – Water Resources Engineering. Learning Objectives. Describe model components and inputs Enter rainfall, catchment, and other input data

E N D
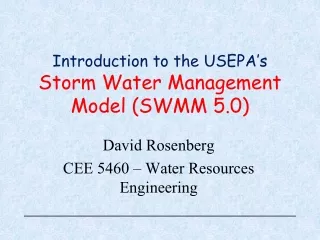
Introduction to the USEPA’sStorm Water Management Model (SWMM 5.0) David Rosenberg CEE 5460 – Water Resources Engineering
Learning Objectives • Describe model components and inputs • Enter rainfall, catchment, and other input data • Generate the outflow hydrograph for a design storm over a catchment • http://www.epa.gov/nrmrl/wswrd/wq/models/swmm/ CEE 5460
What Is SWMM? • Distributed, dynamic rainfall-runoff simulation model • Simulate single or long-term (continuous) events • Runoff quantity and quality from primarily urban areas
What Is SWMM? • Distributed, dynamic rainfall-runoff simulationmodel • Simulate singleor long-term (continuous) events • Runoff quantityand quality from primarily urban areas
Typical Uses • Design and size drainage system components including detention facilities • Map flood plains of natural channel systems • Control combined and sanitary sewer overflows • Generate non-point source pollutant loadings for wasteload allocation studies • Evaluate BMPs and LIDs for sustainability goals CEE 5460
Model Components Visual Rain gage Subcatchment Junction Outfall Divide Storage unit Conduit Pump Orafice Weir Outlet • Non-Visual • Climate data • LID controls • Snow packs • Aquifers • Unit hydrographs • Transects • External inflows • Control rules • Pollutants • Land uses • Treatment • Time-series CEE 5460
Representing land use in a subcatchment Pervious area Impervious area with no storage Impervious area with depression storage Outlet CEE 5460
File menu Working with SWMM Tools Object toolbar Backdrop image Visual objects Edit objects
Using SWMM CEE 5460
2. Set project defaults • Select Infiltration model
4. Add visual objects • Click an object from the object tool bar • Place it on the map • Subcatchment • For conduits, click the start object, then the destination object • Rain gage • Junction • Conduit • Outflow
5. Enter data • Right-click an object => select properties • For subcatchments • Assign a rain gage • Assign an outlet • Enter data fields • Explanations are at the bottom! • Enter the Curve Number (for SCS method) by double-clicking Infiltration
5. Enter data (continued) Precipitation • Add a rain gage • Define the time-series
6. Simulation Set up • Select Options=>General • Select Process Models, Infiltration method, and Routing Model (steady flow for PBL-2) • Set Dates of simulation period • Set computational time step
7. Run the Simulation • Select Project => Run Simulation • Or click
7. Run the Simulation (cont.) • Successful when continuity error is low (< 10%)
8. View Results Graphs Tables Statistics etc.
8. View Results (cont.) CEE 5460
Example 1. Generate the runoff hydrograph from Lundstrum Park, Logan • Use last Thursday’s 6-hr duration Layton storm with a 10-year recurrence interval • Lunstrum Park (blue) • 18.4 acres • 1,440 ft length to divide • Dense grass • 40’ road width
Example 1. Questions to Answer • What inputs did you change/enter? • What is the peak flow? • When does the peak flow occur? • Why do these values differ from our example from Tuesday? Hint 1: What processes does SWMM simulate? SCS? Hint 2: Look at the precipitation intensity values CEE 5460
Example 1. Answers • Set the rain gage and outlet • Area = 18.4 ac • Width = Area/length to divide • % slope = 3.125% • %Imperv = 3% • N-imperv = 0.011 (from manual) • N-perv = 0.15 (from manual) • Dstore-imperv = 0.075 (manual) • Dstore-Perv = 0.15 (from manual) • Curve Number = 61 (from Sept 27)
Example 1. Answers (cont) • Set simulation time step • Resulting subcatchment runoff hydrograph
Model Limitations • Only for small-scale, urban watersheds • Not applicable to forested areas or irrigated cropland • Cannot be used with highly disaggregated (e.g., daily) rainfall data • It’s an analysis tool, not an automated design tool CEE 5460
Conclusions • SWMM simulates runoff from urban watersheds • Includes precipitation, pervious and impervious land cover, depression storage, infiltration, etc. • Can include pipes, channels, weirs, orafices, drainage systems, curbs, constructed features, and • Detention basins (next week) CEE 5460
Additional Resources • Model downloads and documentation http://www.epa.gov/nrmrl/wswrd/wq/models/swmm/ • SWMM User’s Manual Yes, read it! Appendices provide suggested model inputs • SWMM-USERS List Server Email:listserv@listserv.uoguelph.ca With the statement in the body SUBSCRIBE SWMM-USERS [first name] [last name] CEE 5460