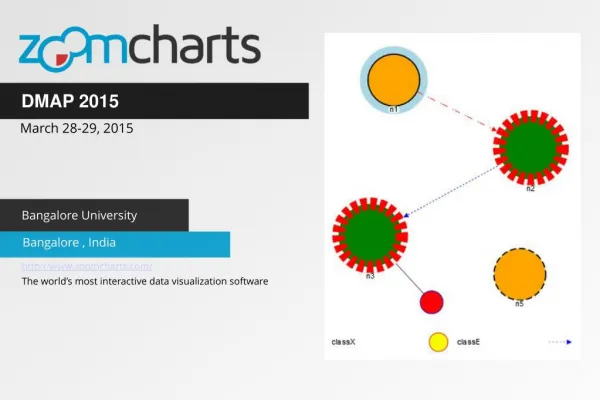
ZoomCharts for DMAP 2015 in Bangalore, India
ZoomCharts is offering data visualization tools to support presenters at the International Conference on Data Mining and Applications (DMAP 2015), taking place March 28-29th, 2015 at Bangalore University, Mysore Road, Jnana Bharathi Campus Bengaluru, Karnataka 560056 Bangalore, India.
Check out what you can do with ZoomCharts charts and graphs at http://zoomcharts.com
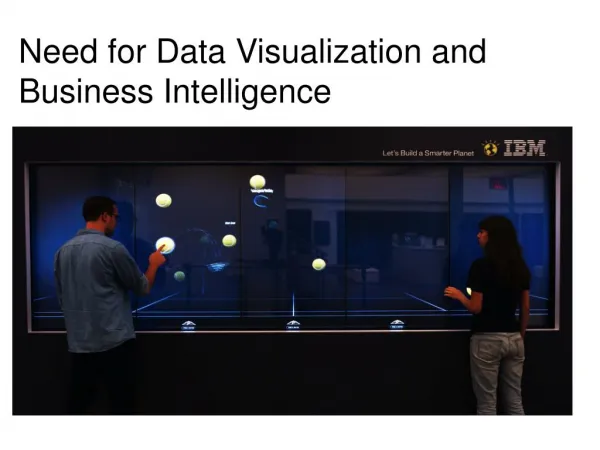
ZoomCharts’ line of advanced data visualization software is completely interactive, supports big data, works on all modern devices including touch screens, and does it all at fast speeds unmatched by any other visualization software of its kind. These tools are being explored by a growing number of clients in a variety of fields as the best way to analyze and present data. Don’t be among the last to discover the exciting potential that ZoomCharts tools can open up for your data.
Hosted by AIRCC Publishing Corporation, an emerging peer reviewed, academic open access Computer Science and Engineering publisher, DMAP is a conference that provides researchers the opportunity to present their work on significant advances in data mining and applications in a peer-reviewed forum. DMAP gathers original research paper submissions on topics of interest such as data mining applications, data mining in modeling, visualization, personalization, and recommendation, data mining systems and platforms, efficiency, scalability, and privacy, foundations, algorithms, models, and theory, mining text, semi-structured, spatio-temporal, streaming, graph, web, multimedia, and knowledge processing. The proceedings will be published by Computer Science Conference Proceedings in Computer Science & Information Technology (CS & IT).
ZoomCharts
http://www.zoomcharts.com
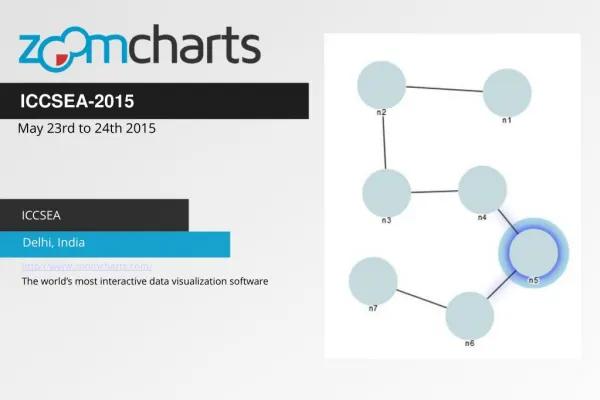
The world’s most interactive data visualization software
★
★
★
★
★
179 views • 5 slides