Understanding ANOVA and Regression Analysis
Learn about estimating and testing variance with chi-square and F-distribution, conducting One-Way and Two-Way ANOVA, hypothesis testing, and regression analysis.

Understanding ANOVA and Regression Analysis
E N D
Presentation Transcript
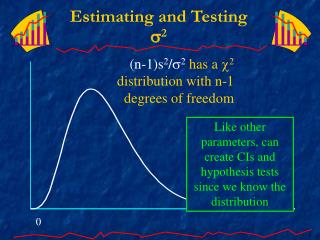
Estimating and Testing 2 (n-1)s2/2 has a 2 distribution with n-1 degrees of freedom Like other parameters, can create CIs and hypothesis tests since we know the distribution 0
Estimating and Testing 12 /22 12/22has an F distribution with n1-1 and n2-1 d.f. Like other parameters, can create CIs and hypothesis tests since we know the distribution 0
One-Way ANOVA • Example • As a training specialist, you want to determine whether three different training methods are equally effective so you want to compare the mean time to complete a task after individuals are trained with the three different methods. (Random variable: completion time) • One-Way ANOVA hypothesis test • H0: 1 = 2 = 3 = . . . = k • HA: The means are not all equal (at least one pair differs from each other) • Three Requirements • k independent random samples • Random variables are normally distributed • Equal population variances for the random variables
One-Way ANOVA Data Set x1,1 x1,2 x1,3 … x2,1 x2,2 x2,3 … xk,1 xk,2 xk,3 … _ _ _
One-Way ANOVA • One-Way ANOVA hypothesis test • H0: 1 = 2 = 3 = . . . = k • HA: The means are not all equal (at least one pair differs from each other) • Test Statistic • F = BSV / WSV with k-1, nT-k d.f. • Decision Rule • Reject H0 if F > F • Intuition • If BSV is “large” then H0 is unlikely to be true Note: Always one-tailed and >
F Distribution P(F < ) = 0.95 9 and 10 d.f P(F > ) = 0.05 0 ?
Select F Distribution 5% Critical Values Denominator Degrees of Freedom
One-Way ANOVA: Example • H0: 1 = 2 = 3 • HA: The means are not all equal • Test Statistic • F = BSV / WSV with k-1,nT-k d.f. • Decision Rule • Reject H0 if F > F • Intuition • If BSV is “large” then H0 is unlikely to be true _ =
One-Way ANOVA: Another Example • H0: 1 = 2 = 3 • HA: The means are not all equal • Test Statistic • F = BSV / WSV with k-1,nT-k d.f. • Decision Rule • Reject H0 if F > F • Intuition • If BSV is “large” then H0 is unlikely to be true _ =
Two-Way ANOVA • Example • Suppose 10 individuals are asked to judge the taste quality of three beers: Budweiser, Bass Ale, and London Pride. Based on some complicated rating system, each individual assigns a numerical score to each beer (all 10 individuals taste each of the three beers). • Note that we now have two factors: raters and beers • Questions • Is the average taste rating equal for each beer? • Is the average taste rating equal for each rater? • Can do an ANOVA hypothesis test for each question: • H0: 1 = 2 = 3 = . . . = k • HA: The means are not all equal (at least one pair differs from each other)
Two-Way ANOVA: Example • Suppose 10 individuals are asked to judge the taste quality of three beers: Budweiser, Bass Ale, and London Pride. Based on some complicated rating system, each individual assigns a numerical score to each beer (all 10 individuals taste each of the three beers). Once the data are collected, you estimate the following ANOVA table:
Another Example • These data values were obtained from a randomized block design experiment. • First, Pretend that these data were collected using a completely randomized design. Can we conclude at the 5% significance level that there are differences in the treatment means? • How does your answer change if you account for the randomized block design?
One-Way ANOVA via Regression “Stack” data using dummy variables
The RegressionANOVA Table F test for: Ho: 1= 2 = … = k = 0 (excluding the intercept) HA: at least one i0
Regression and Two-Way ANOVA Blocks “Stack” data using dummy variables
Regression and Two-Way ANOVA Source | SS df MS Number of obs = 15 ----------+---------------------- F( 6, 8) = 28.00 Model | 338.800 6 56.467 Prob > F = 0.0001 Residual | 16.133 8 2.017 R-squared = 0.9545 -------------+------------------- Adj R-squared = 0.9205 Total | 354.933 14 25.352 Root MSE = 1.4201 ------------------------------------------------------------- treatment | Coef. Std. Err. t P>|t| [95% Conf. Int] ----------+-------------------------------------------------- b | -2.600 .898 -2.89 0.020 -4.671 -.529 c | -3.000 .898 -3.34 0.010 -5.071 -.929 b2 | -1.333 1.160 -1.15 0.283 -4.007 1.340 b3 | 6.667 1.160 5.75 0.000 3.993 9.340 b4 | 9.667 1.160 8.34 0.000 6.993 12.340 b5 | -1.333 1.160 -1.15 0.283 -4.007 1.340 _cons | 10.867 .970 11.20 0.000 8.630 13.104 ------------------------------------------------------------- Need Partial F test (later in course)