Download
1 / 7
70 likes | 176 Vues
Learn about HARP patches and geometric complexities in active regions. Explore how HARPs are constructed and why their bounding boxes differ in size. Discover the significance of consistent sizing for AR studies.

E N D
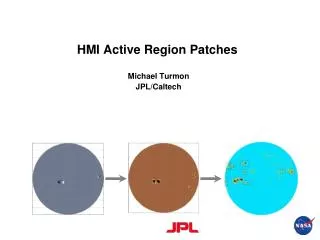
HMI Active Region Patches Michael TurmonJPL/Caltech
Mask and Patch Data Products Mask: 2011/02/14 12:00 • Magnetograms (M_720s) + intensitygrams (Ic_720s) yield activity masks (Marmask_720s). • Active clumps in Marmask_720s are grouped into “instantaneous patches” (Mpatch_720s) • The instantaneous patches are linked temporally using an overlap metric to produce HARPs (HMI ARPatch) • A HARP is about the scale of a NOAA active region. • We have its entire history. zoom HARP (text overlayin this imageis flipped)
HARP Geometry • HARPs are a simple concept, but their geometry can be complex. • They are often not “simply connected” • I.e., a single HARP can consist of multiple compact blobs • Their configuration is unknown until final demise • HARPs are retrospectively pasted together (“merged”) as future growth is observed One Day Earlier HARPs: 2011/02/14 12:00 One Day Later
Delivering the HARPs as a Data Product • HARPs are a sequence of cut-outs from the original image set. • To use, you shift the cut-out to the correct place in M_720s, etc. • There is no complex transformation. Just a shift in pixel coordinates. • In JSOC, the HARP data series is indexed by HARP number, analogous to NOAA AR number, and time. • Encoding: on-HARP (orange patch) is ≥ 64; active area within HARP is 66; inactive within HARP is 65. (Using symbolic KWs) Mag: 2011/02/14 12:00 Instantaneous bounding box HARP bounding box (bigger) HARP origin
What the HARP is aimed at • Why is the HARP bounding box larger than the instantaneous bounding box? How is that size determined? • Note: You do need not to know or remember these details. • We want the HARP to be in image coordinates for ease-of-use, but we also want the HARP to be a consistent size for AR studies • Key: The HARP cutout is made as if seen by observer hovering above the AR, moving at a constant angular rate (deg. lon/day). • Per-HARP angular rate determined from differential rotation formula in powers of sin2(lat) evaluated at HARP centroid in latitude, and encoded in HARP KWs. • The dimensions (degrees lon X degrees lat) of the HARP is given by the smallest lat-lon bounding box that encompasses all presentations of the HARP from birth to death. • HARPs have equal extent in longitude => they are “tall” at the limb.
Graphical Overview of HARP Sizing • Orange pixels are on-HARP; black pixels are active. The white line marks the instantaneous bounding box (in image-pixel coordinates). • The blue dots mark the lat-lon center of the HARP. The center has a constant latitude and advances in longitude with constant rate. • The red boxes show a fixed-size lat-lon bounding box, centered on the blue dots, which encompasses all HARP pixels at all times. • The HARP is the smallest image-domain box containing the red boxes. Time Same lat/lon
Acknowledgement The research described in this paper was carried out in part by the Jet Propulsion Laboratory, California Institute of Technology, under a contract with NASA.