Enhancing Gene Prediction with Conservation Score Coefficient (CSC) in ISCAN
Investigating the impact of Conservation Score Coefficient (CSC) on gene prediction accuracy in ISCAN. Learn how CSC combines target DNA and conservation sequences to improve predictions. Discover results, modifications required for ISCAN, and comparison with NSCAN.

Enhancing Gene Prediction with Conservation Score Coefficient (CSC) in ISCAN
E N D
Presentation Transcript
Conservation Score Coefficient (CSC) Does the choice of CSC improve gene prediction in ISCAN? Rachel Pusey 27 July 2005
Value added prediction Conservation sequence Mouse:••││-││-•• ISCAN Prediction Target DNA sequence Human: TATTCAG Informant sequence(s) Mouse: GGACGTG Chicken:GTACGAG NSCAN
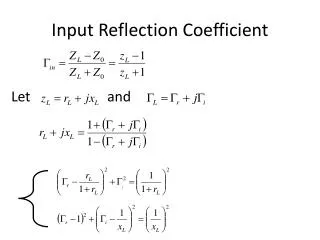
What is the CSC? In the midst of the Viterbi algorithm: • log likelihood used to decide the most likely state for this base/position • normally just for the DNA target sequence • in NSCAN/ISCAN also have the informant/conservation sequence(s) • combine the two log likelihoods: just add them together
What is the CSC? ISCAN log(Ts(i)/Tnull(i)) + CSC • log(Cs(i)/Cnull(i)) T : target DNA C : conservation CSC : conservation sequence constant NSCAN log(Ts(i)/Tnull(i)) + PSC • log(Is(i)/Inull(i)) T : target DNA I : informant PSC : phylogenetic sequence constant
NSCAN results • Results already calculated for NSCAN, showing how prediction accuracy varied with PSC. • Noticable improvement for values ~0.4 i.e. less influence for the informants. Ref: Using Multiple Alignments to Improve Gene PredictionSamuel S. Grossand Michael R. Brent
What about ISCAN? • Alter current version of ISCAN/zoe code • only need to change half a dozen lines • (CVS not updated) • Run on the human genome • parameter source • /bio/pkg/parameter/human/human_iscan_utr.zhmm • DNA source • /bio/pro/Homo_sapiens/assembly/hg17/chr_split/<chr#>/fragment_<frag#>/<frag#>.seq.masked
The usual pipeline • Run modified ISCAN on 1MB fragments → gtf output • Run unsplit_twinscan_gtf.pl to glue the fragments back together • Run evaluate_gtf.pl on individual chromosomes, also on aggregate lists • source for gtf for evaluation • /bio/db/Homo_sapiens/assembly/hg17/annotation/refseqs_v2/chr<chr#>.eval.gtf
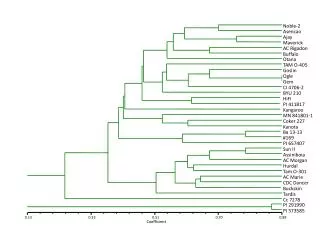
Summary • Less pronounced effect for CSC than PSC • Peak around 0.6-0.7 • Considerable variation between chromosomes e.g. • chr1 similar to aggregate, smooth curve • chr13, chrY flat with noise
Conclusion? • Haven't been missing out on the panacea for all ills – or at least this isn't it.