Comparative Analysis of Milk Production Costs Among Farm Sizes
This study compares relative production costs for milk across different farm sizes using primary data sources. Analytical procedures are employed to evaluate major cost components, stocking density, and variable costs such as feed, labor, and utilities. The research classifies farms based on revenue, operating costs, and gross margin to assess the profitability of milk production. Detailed results and conclusions highlight trends in variable costs, gross margin, and the challenges faced by farmers in covering overhead expenses.

Comparative Analysis of Milk Production Costs Among Farm Sizes
E N D
Presentation Transcript
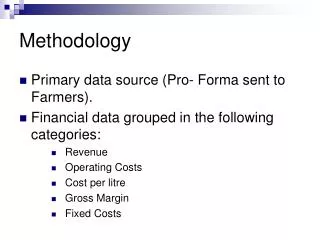
Methodology • Primary data source (Pro- Forma sent to Farmers). • Financial data grouped in the following categories: • Revenue • Operating Costs • Cost per litre • Gross Margin • Fixed Costs
Analytical Procedures • Compare relative production cost for milk in all categories of farm size. • Compare major cost components as a proportion of variable cost. • Compare milk production at various stocking density across farms.
Variable Costs • Variable costs (operating costs) are expenses that change in proportion to the quantity of output of a business. • Variable costs include concentrate and other feeds, fertilizer, pasture maintenance, labour, veterinary services, chemicals, utilities, haulage, contract services and miscellaneous costs.
Gross Margin • Income above operating cost or contribution to fixed cost. • Another way of viewing is income after variable cost. • Gross Margin = Revenue – Variable costs
Fixed Costs • Fixed costs or overheads. These costs do not change with level of output. • Includes: Land charge, depreciation, interest on livestock investment, management costs. • The costs associated with owning a fixed input.
Table 1: COMPARISON OF VARIABLECOST PER LITRE AMONG FARM SIZES
TABLE 2: COMPARISON OF MEAN STOCKING RATES AND PRODUCTION /HA AMONG FARM SIZES
TABLE 3: COMPARISON OF LOCAL AND INTERNATIONAL COSTS OF PRODUCING MILK NB. Retail prices (USA.): Brian Gould, Agricultural & Applied Economics, UW Madison
TABLE 4:COMPARISON OF AVERAGE VARIABLE COSTS OVER THE PAST 7 YEARS ON MEDIUM & LARGE FARMS
TABLE 6: CHANGES IN PROPORTION (%) OF VARIABLE COST DUE TO THE VARIOUS INPUT CATEGORIES
TABLE 7: COMPARISON OF AVERAGE GROSS MARGIN/LITRE AMONG FARM SIZES
Summary and Conclusions • Average variable cost was J$ 46.93, an increase of 22% over 2008. • Non - irrigated farms averaged J$ 47.38. • Irrigated farms averaged J$ 43.55, ie 9% better than non-irrigated farms. • Large and medium farms margin -1.0 percent.
Conclusions • Fifty percent (53%) of farmers in the survey produced milk marginally above variable cost. • In the main, there was not sufficient margin to cover overhead. • High input costs particularly energy and feed were the main contributors.