Download
1 / 42
420 likes | 611 Vues
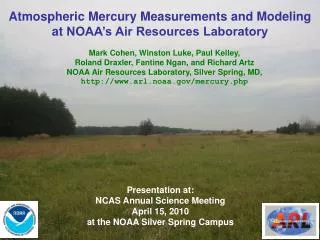
Atmospheric Mercury Modeling 101 Mark Cohen Air Resources Laboratory ARL 101 June 19, 2012. In many waterbodies – including the Great Lakes and Gulf of Mexico -- levels of mercury in some fish are too high for safe consumption by humans and wildlife.

E N D
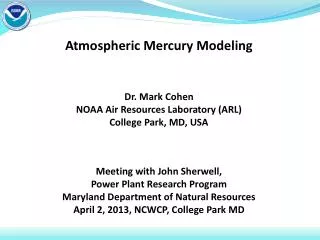
Atmospheric Mercury Modeling 101 Mark Cohen Air Resources Laboratory ARL 101 June 19, 2012 Air Resources Laboratory
In many waterbodies – including the Great Lakes and Gulf of Mexico -- levels of mercury in some fish are too high for safe consumption by humans and wildlife Air Resources Laboratory
Mercury Concentrations in Gulf of Mexico Seafood Species approximate concentration in light tuna – can have 12 oz per week Air Resources Laboratory
In many waterbodies – including the Great Lakes and Gulf of Mexico -- levels of mercury in some fish are too high for safe consumption by humans and wildlife • For many waterbodies, atmospheric deposition is the largest loading pathway for mercury • For a given waterbody, where does the mercury come from that is deposited? Air Resources Laboratory
Atmospheric mercury emitted from other regional and more distant sources • dry deposition: pollutants brought down to the earth’s surface in the absence of rain or snow • Gaseous pollutants can be absorbed by the surface • Particles with pollutants on them can “fall” to the surface wet deposition: pollutants brought down to the earth’s surface in rain and snow
Large Point Sources of Mercury Emissions Based on the 2002 EPA NEI and 2002 Envr Canada NPRI* size/shape of symbol denotes amount of mercury emitted (kg/yr) 5 - 10 10 - 50 50 - 100 100 – 300 300 - 500 500 - 1000 1000 - 3000 color of symbol denotes type of mercury source coal-fired power plants other fuel combustion waste incineration metallurgical manufacturing & other 2002 U.S. and Canadian Emissions of Total Mercury [Hg(0) + Hg(p) + RGM] There are a lot of sources! * Note – some large Canadian point sources may not be included due to secrecy agreements between industry and the Canadian government.
Anthropogenic Mercury Emissions (ca. 2005) Air Resources Laboratory
Lagrangian Puff Atmospheric Fate and Transport Model 0 1 2 TIME (hours) The puff’s mass, size, and location are continuously tracked… = mass of pollutant (changes due to chemical transformations and deposition that occur at each time step) Phase partitioning and chemical transformations of pollutants within the puff are estimated at each time step Initial puff location is at source, with mass depending on emissions rate Centerline of puff motion determined by wind direction and velocity Dry and wet deposition of the pollutants in the puff are estimated at each time step. deposition 2 deposition to receptor deposition 1 lake NOAA HYSPLIT MODEL
deposition (ug/m2)* Beltsville monitoring site 100 - 1000 10 – 100 1 - 10 0.1 – 1 Washington D.C. NOAA Silver Spring Model-predicted hourly mercury deposition (wet + dry) in the vicinity of one example Hg source for a 3-day period in July 2007 one Hg emissions source * hourly deposition converted to annual equivalent
deposition (ug/m2)* Beltsville monitoring site 100 - 1000 10 – 100 1 - 10 0.1 – 1 Washington D.C. NOAA Silver Spring Model-predicted hourly mercury deposition (wet + dry) in the vicinity of one example Hg source for a 3-day period in July 2007 one Hg emissions source * hourly deposition converted to annual equivalent
Large, time-varying spatial gradients in deposition & source-receptor relationships deposition (ug/m2)* Beltsville monitoring site 100 - 1000 10 – 100 1 - 10 0.1 – 1 Washington D.C. NOAA Silver Spring Model-predicted hourly mercury deposition (wet + dry) in the vicinity of one example Hg source for a 3-day period in July 2007 one Hg emissions source * hourly deposition converted to annual equivalent
Here’s where the mercury is emitted from... But what is the relative importance of different source regions to atmospheric deposition of mercury to the Great Lakes? Does most of it come from China? Policy-Relevant Scenario Analysis Geographical Distribution of 2005 Atmospheric Mercury Emissions (Natural + Re-emit + Direct Anthropogenic) 13 NOAA Air Resources Laboratory Presentation to IJC-IAQAB, Apr 25, 2012
Here’s where the mercury came from that was deposited to Lake Erie (~2005) Policy-Relevant Scenario Analysis Geographical Distribution of 2005 Atmospheric Mercury Deposition Contributions to Lake Erie 14 NOAA Air Resources Laboratory Presentation to IJC-IAQAB, Apr 25, 2012
Modeling results show that these “regional” emissions are responsible for a large fraction of the modeled 2005 atmospheric deposition • A tiny fraction of 2005 global mercury emissions within 500 km of Lake Erie Important policy implications! 15 NOAA Air Resources Laboratory Presentation to IJC-IAQAB, Apr 25, 2012
Model-estimated 2005 deposition to the Great Lakes Basin from countries with the highest modeled contribution from direct and re-emitted anthropogenic sources 16 NOAA Air Resources Laboratory Presentation to IJC-IAQAB, Apr 25, 2012
To get the answers we need, we need to use both monitoring and modeling -- together Modeling needed to help interpret and extend measurements and to estimate source-receptor relationships Monitoring needed to ground-truth models and provide solid deposition estimates at specific locations
Extra Slides Air Resources Laboratory
Herring Salmon Halibut Swordfish Shark Tilefish Tuna (fresh or frozen) Oysters Flounder or Sole Pollock Lobster Crabs King Mackerel Shrimp Red Snapper Tuna* Grouper Mahi Mahi Clams Catfish Scallops Cod Orange Roughy * canned, light Graph based on data presented by the American Heart Association -- http://www.americanheart.org
Number of Samples 300 - 700 100 - 300 50 - 100 10 - 50 1 - 10 x Mercury Levels in Commercial Fish and Shellfish “error bars” show range of mercury concentrations in data for a given species Fish concentration data from NOAA and FDA. Downloaded Sept 2008 from the EPA-FDA fish-mercury website: http://www.cfsan.fda.gov/~frf/sea-mehg.html
What Influences Hg Levels in Fish? • Current / past atmospheric and other Hg inputs to the fish’s ecosystem • Biogeochemical factors influencing the degree of mercury methylation in the ecosystem (sulfate, dissolved organic carbon, pH, etc) • Food web structure of the waterbody and trophic level of species • Age (size) of fish – as fish age, they accumulate more and more mercury • History of that particular fish • Note – Hg in fish muscle tissue, so can’t easily avoid it (PCB’s, Dioxins and other hydrophobic contaminants concentrated in fat) • Knowledge gaps for Hg levels and reasons for levels: • freshwater (inland) fish -- LARGE • estuarine & marine fish -- VERY LARGE
Mean Methylmercury Concentrations for "Top 24" Types of Fish Consumed in U.S. Commercial Seafood Market Source of data: Carrington and Bolger, 2002 Based on slide from: Elsie Sunderland, USEPA
Percent Contribution to per capita Methylmercury Intake by Fish Type for "Top 24" Types of Fish in U.S. Commercial Seafood Market Source of data: Carrington and Bolger, 2002 Based on slide from: Elsie Sunderland, USEPA
U.S. Population-Wide Consumption & Hg Exposure for Marine and Estuarine Fish Percentage of total Hg intake (product of seafood supply and Hg concentrations) for the top 15 seafood categories; intake is allocated by the source region for each of the fisheries products [Atlantic, Pacific, imported (foreign sources), and high seas landings]. Seafood consumption estimated in this study from NMFS fisheries supply data compared with available data for marine and estuarine fish consumption from CSFII dietary survey data [uncooked weights (U.S. EPA 2002]. Sunderland, E. (2007). Mercury exposure from domestic and imported estuarine and marine fish in the U.S. seafood market. Environ Health Perspect115(2):235-42.
Source: Gary Ginsberg, Connecticut Dept of Public Health (2007). “Risk-Benefit Synthesis for Fish Consumption Advisories,” presented at National Forum on Fish Contaminants, Portland, ME. http://www.epa.gov/waterscience/fish/forum/2007/pdf/section2f.pdf
Model-estimated per capita 2005 deposition to the Great Lakes Basin from countries with the highest modeled contribution from direct & re-emitted anthropogenic sources 26 NOAA Air Resources Laboratory Presentation to IJC-IAQAB, Apr 25, 2012
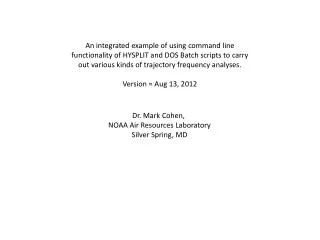
Modeling – Approaches • Back-trajectory analyses with HYSPLIT • Fate and transport modeling with HYSPLIT-Hg …focus on source-receptor relationships Air Resources Laboratory
Back Trajectory Analysis – Episodes Beltsville, Maryland mercury site Reactive Gaseous Mercury episode Air Resources Laboratory
Baltimore Chesapeake Bay Washington D.C. Air Resources Laboratory
Polar-specific air-chemistry can lead to enhanced mercury deposition under some conditions mercury from global atmospheric pool entering North America mercury that doesn’t deposit continues its global circulation regional and and global sources contribute to atmospheric mercury deposition North American mercury sources * Atmospheric mercury deposition varies spatially and temporally, and is always a complex combination of impacts from local, regional, national, and global emissions sources. Thousands of fish-advisories throughout North America due to mercury contamination Air Resources Laboratory
Different “forms” of mercury in the atmosphere • Elemental Mercury -- Hg(0) • most of total Hg in atmosphere • doesn’t easily dry or wet deposit • globally distributed • Elemental Mercury -- Hg(0) • most of total Hg in atmosphere • doesn’t easily dry or wet deposit • globally distributed ? • Reactive Gaseous Mercury -- RGM • a few % of total atmos. Hg • oxidized Hg (HgCl2, others) • very water soluble and “sticky” • bioavailable • Reactive Gaseous Mercury -- RGM • a few % of total atmos. Hg • oxidized Hg (HgCl2, others) • very water soluble and “sticky” • bioavailable • Particulate Mercury -- Hg(p) • a few % of total atmos. Hg • Hg in/on atmos. particles • atmos. lifetime 1~ 2 weeks • bioavailability? • Particulate Mercury -- Hg(p) • a few % of total atmos. Hg • Hg in/on atmos. particles • atmos. lifetime 1~ 2 weeks • bioavailability? ? Air Resources Laboratory
Modeling – Comprehensive Fate and Transport Simulations • Start with an emissions inventory • Use gridded meteorological data • Simulate the dispersion, chemical transformation, and wet and dry deposition of mercury emitted to the air • Source-attribution information needed at the end, so optimize modeling system and approach to allow source-receptor information to be captured • HYSPLIT-Hg developed over the last ~10 years with specialized algorithms for simulation of atmospheric mercury Air Resources Laboratory
Context • Provide sound scientific information on the emission, dispersion, transformation, and air-surface exchange of atmospheric mercury compounds • Measure and understand spatial and temporal trends in air concentrations and air-surface exchange • Provide robust source-attribution information for atmospheric mercury deposition to sensitive ecosystems, to inform policies to reduce loadings • Mercury exposure via fish consumption is an important public health concern • NOAA has a primary stewardship responsibility for the nation’s fisheries • Atmospheric emissions and subsequent deposition is a significant pathway through which mercury contamination enters sensitive aquatic ecosystems Goals Air Resources Laboratory
Mercury: Measurements and Modeling MEASUREMENTS MODELING Modeling used to aid in data interpretation and measurement planning speciated atmospheric mercury back trajectories comprehensive fate and transport other air pollutants, e.g., SO2, O3, CO wet deposition air-surface exchange Measurements used for model evaluation and improvement source-attribution for deposition Air Resources Laboratory
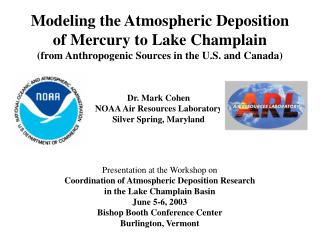
atmospheric deposition to the watershed atmospheric deposition to the water surface Humans and wildlife affected primarily by eating fish containing mercury Best documented impacts are on the developing fetus: impaired motor and cognitive skills Mercury transformed by bacteria into methylmercury in sediments, soils & water, then bioaccumulates in fish adapted from slides prepared by USEPA and NOAA
Environmental Mercury Cycling -- Natural vs. Anthropogenic • Mercury (Hg) is an element... there is the same amount of mercury on Earth today as there always has been • “natural” Hg cycle: • transported throughout the environment • chemical transformations interconvert different mercury species • This has always been going on, ... always has been Hg in fish
Pre-Industrial Global Mercury Cycling Sunderland and Mason (2007). Global Biogeochemical Cycles 21, 4022
GLOBAL MERCURY CYCLING (note -106 moles ~ 200 metric tons) natural extraction from deep reservoirs, e.g., volcanoes natural evasion from ocean natural evasion from land pre-industrial: total mercury in atmosphere ~ 8.0 x 10⁶ moles 106 moles per year natural dep to land natural dep to ocean Based on data presented in Sunderland and Mason (2007) Global Biogeochemical Cycles21: GB4022
Environmental Mercury Cycling -- Natural vs. Anthropogenic • Mercury (Hg) is an element... there is the same amount of mercury on Earth today as there always has been • “natural” Hg cycle – Hg is transported throughout the environment, and chemical transformations interconvert different mercury species • This has always been going on, and there has always been Hg in fish • But, we make some Hg unexpectedly “bioavailable” • Most anthropogenic Hg is “released” as atmospheric emissions: • Hg in coal is released to the air when coal is burned • Hg in other fuels is released to the air when they are processed and burned • Hg in ores is released to the air during metallurgical processes • Hg in products is released to the air when burned or landfilled after being discarded (e.g., batteries, switches) • Average, current atmospheric Hg deposition is ~3x pre-industrial levels • Evidence suggests that newly deposited Hg is more bioavailable
anthrop direct emit anthrop re-emit from ocean anthrop re-emit from land 106 moles per year contemporary: total mercury in atmosphere ~ 28.0 x 10⁶ moles anthrop dep to land anthrop dep to ocean GLOBAL MERCURY CYCLING (note -106 moles ~ 200 metric tons) natural extraction from deep reservoirs, e.g., volcanoes natural evasion from ocean natural evasion from land pre-industrial: total mercury in atmosphere ~ 8.0 x 10⁶ moles 106 moles per year natural dep to land natural dep to ocean Based on data presented in Sunderland and Mason (2007) Global Biogeochemical Cycles21: GB4022
Freemont Glacier, Wyoming source: USGS, Shuster et al., 2002 Natural vs. anthropogenic mercury? Studies show that anthropogenic activities have typically increased bioavailable Hg concentrations in ecosystems by a factor of 2 – 10
Hg from other sources: local, regional & more distant Measurement of ambient air concentrations Measurement of wet deposition