Download

1 / 62
620 likes | 1.11k Vues
Atmospheric Mercury Modeling at the NOAA Air Resources Laboratory using the HYSPLIT-Hg Model. Dr. Mark Cohen NOAA Air Resources Laboratory 1315 East West Highway, R/ARL, Room 3316 Silver Spring, Maryland, 20910 mark.cohen@noaa.gov http://www.arl.noaa.gov/ss/transport/cohen.html.

E N D
Atmospheric Mercury Modeling at the NOAA Air Resources Laboratory using the HYSPLIT-Hg Model Dr. Mark Cohen NOAA Air Resources Laboratory 1315 East West Highway, R/ARL, Room 3316 Silver Spring, Maryland, 20910 mark.cohen@noaa.gov http://www.arl.noaa.gov/ss/transport/cohen.html Presentation at the Gulf Coast Mercury Research Collaboration Meeting Gulf Power Building, Pensacola FL, May 18-19, 2006
Outline of Presentation • modeling methodology • some preliminary results for Mobile Bay (based on this methodology) • model intercomparisons • summary of previous work; current goals; challenges 2
Outline of Presentation • modeling methodology • some preliminary results for Mobile Bay (based on this methodology) • model intercomparisons • summary of previous work; current goals; challenges 3
Modeling Methodology • NOAA HYSPLIT model HYSPLIT-Hg 4
Lagrangian Puff Atmospheric Fate and Transport Model 0 1 2 TIME (hours) The puff’s mass, size, and location are continuously tracked… = mass of pollutant (changes due to chemical transformations and deposition that occur at each time step) Phase partitioning and chemical transformations of pollutants within the puff are estimated at each time step Initial puff location is at source, with mass depending on emissions rate Centerline of puff motion determined by wind direction and velocity Dry and wet deposition of the pollutants in the puff are estimated at each time step. deposition 2 deposition to receptor deposition 1 lake NOAA HYSPLIT MODEL 5
Modeling Methodology • NOAA HYSPLIT model HYSPLIT-Hg • Modeling domain: North America (northern half of Mexico; continental U.S.; southern half of Canada) • 1996 meterology (180 km horizontal resolution) 7
Modeling Methodology • NOAA HYSPLIT model HYSPLIT-Hg • Modeling domain: North America (northern half of Mexico; continental U.S.; southern half of Canada) • 1996 meterology (180 km horizontal resolution) • onlyU.S. and Canadian anthropogenic sources; (natural emissions, re-emissions, & global sources not included) • Model evaluation:1996 emissions and 1996 monitoring data (also evaluated in EMEP Hg model intercomparison project) 9
Figure 7. Model evaluation sites for wet deposition fluxes within 250 km of any Great Lake with available data for 1996.(Cohen et al., 2004, Environmental Research 95: 247-265) 10 (Cohen et al., 2004, Environmental Research 95: 247-265)
Figure 8. Comparison of annual model-estimated wet deposition fluxes with measured values at sites within 250 km of the Great Lakes during 1996. The range of modeled estimates shown for each site represents the difference in estimated deposition in using the NGM-forecast model precipitation and the actual precipitation at the site. (Cohen et al., 2004, Environmental Research 95: 247-265) 11
Modeled vs. Measured Wet Deposition at Mercury Deposition Network Site DE_02 during 1996 12
Modeling Methodology • NOAA HYSPLIT model HYSPLIT-Hg • Modeling domain: North America (northern half of Mexico; continental U.S.; southern half of Canada) • 1996 meterology (180 km horizontal resolution) • onlyU.S. and Canadian anthropogenic sources; (natural emissions, re-emissions, & global sources not included) • Model evaluation:1996 emissions and 1996 monitoring data (also evaluated in EMEP Hg model intercomparison project) • 1st set of results – Cohen et al. 2004 13
Cohen, M., Artz, R., Draxler, R., Miller, P., Poissant, L., Niemi, D., Ratte, D., Deslauriers, M., Duval, R., Laurin, R., Slotnick, J., Nettesheim, T., McDonald, J. “Modeling the Atmospheric Transport and Deposition of Mercury to the Great Lakes.” Environmental Research 95(3), 247-265, 2004. Note: Volume 95(3) is a Special Issue: "An Ecosystem Approach to Health Effects of Mercury in the St. Lawrence Great Lakes", edited by David O. Carpenter. 14
Modeling Methodology • NOAA HYSPLIT model HYSPLIT-Hg • Modeling domain: North America (northern half of Mexico; continental U.S.; southern half of Canada) • 1996 meterology (180 km horizontal resolution) • onlyU.S. and Canadian anthropogenic sources; (natural emissions, re-emissions, & global sources not included) • Model evaluation:1996 emissions and 1996 monitoring data (also evaluated in EMEP Hg model intercomparison project) • 1st set of results – Cohen et al. 2004 • 2nd set of results (examples shown today) – • 1996 meteorology • 1999 U.S. EPA National Emissions Inventory • 2000 emissions data from Environment Canada 15
Geographic Distribution of Largest Anthropogenic Mercury Emissions Sources in the U.S. (1999) and Canada (2000) 16
Outline of Presentation • modeling methodology • some preliminary results for Mobile Bay (based on this methodology) • model intercomparisons • summary of previous work; current goals; challenges 17
some earlier results for Mobile Bay 18
Total modeled mercury deposition at selected receptors arising from from 1999 direct anthropogenic emissions sources in the United States and Canada (IPM coal fired plants are large coal-fired plants in the U.S. only) 19
1996 meteorology (NGM) • 1999 U.S. emissions (EPA NEI) • 2000 Canadian emissions (Envr. Canada) • no sources other than U.S. & Can. anthropogenic emissions • total modeled deposition to Mobile Bay ~ 3.5 g Hg/km2-year Largest Modeled Individual Sources Contributing Mercury Deposition Directly to Mobile Bay (national view) 20
1996 meteorology (NGM) • 1999 U.S. emissions (EPA NEI) • 2000 Canadian emissions (Envr. Canada) • no sources other than U.S. & Can. anthropogenic emissions • total modeled deposition to Mobile Bay ~ 3.5 g Hg/km2-year 21
1996 meteorology (NGM) • 1999 U.S. emissions (EPA NEI) • 2000 Canadian emissions (Envr. Canada) • no sources other than U.S. & Can. anthropogenic emissions • total modeled deposition to Mobile Bay ~ 3.5 g Hg/km2-year Largest Modeled Individual Sources Contributing Mercury Deposition Directly to Mobile Bay (large regional view) 25
1996 meteorology (NGM) • 1999 U.S. emissions (EPA NEI) • 2000 Canadian emissions (Envr. Canada) • no sources other than U.S. & Can. anthropogenic emissions • total modeled deposition to Mobile Bay ~ 3.5 g Hg/km2-year Largest Modeled Individual Sources Contributing Mercury Deposition Directly to Mobile Bay (regional view) 26
1996 meteorology (NGM) • 1999 U.S. emissions (EPA NEI) • 2000 Canadian emissions (Envr. Canada) • no sources other than U.S. & Can. anthropogenic emissions • total modeled deposition to Mobile Bay ~ 3.5 g Hg/km2-year Largest Modeled Individual Sources Contributing Mercury Deposition Directly to Mobile Bay (local view) 27
Top 25 Modeled Contributors to 1999 Hg Deposition Directly to Mobile Bay, considering anthropogenic direct emission sources in the United States and Canada Cumulative Fraction of Modeled Deposition 28
Outline of Presentation • modeling methodology • some preliminary results for Mobile Bay (based on this methodology) • model intercomparisons • summary of previous work; current goals; challenges 29
Model Intercomparisons • EMEP MSC-East (~7 models) • HYSPLIT-Hg vs. ISC • HYSPLIT-Hg vs. CMAQ-Hg 30
Model Intercomparisons • EMEP MSC-East (~7 models) • HYSPLIT-Hg vs. ISC • HYSPLIT-Hg vs. CMAQ-Hg 31
Participants D. Syrakov ……………………………..Bulgaria…. NIMH A. Dastoor, D. Davignon ………………Canada...... MSC-Can J. Christensen…………………………. Denmark…NERI G. Petersen, R. Ebinghaus…………......Germany…GKSS J. Pacyna ………………………………. Norway….. NILU J. Munthe, I. Wängberg ……………….. Sweden….. IVL R. Bullock ………………………………USA………EPA M. Cohen, R. Artz, R. Draxler ………… USA………NOAA C. Seigneur, K. Lohman ………………..USA……... AER/EPRI A. Ryaboshapko, I. Ilyin, O.Travnikov…EMEP…… MSC-E 32
Intercomparison Conducted in 3 Stages • Comparison of chemical schemes for a cloud environment • Air Concentrations in Short Term Episodes • Long-Term Deposition and Source-Receptor Budgets 33
Mace Head, Ireland grassland shore Aspvreten, Sweden forested shore Rorvik, Sweden forested shore Zingst, Germany sandy shore Neuglobsow, Germany forested area Anthropogenic Mercury Emissions Inventoryand Monitoring Sites for Phase II(note: only showing largest emitting grid cells) 35
Mace Head Aspvreten Rorvik Zingst Neuglobsow 36
Neuglobsow NW S SE N NW N NW NW Total Gaseous Mercury at Neuglobsow: June 26 – July 6, 1995 37
Total Gaseous Mercury (ng/m3) at Neuglobsow: June 26 – July 6, 1995 38
Total Particulate Mercury (pg/m3) at Neuglobsow, Nov 1-14, 1999 39
Model Intercomparisons • EMEP MSC-East (~7 models) • HYSPLIT-Hg vs. ISC • HYSPLIT-Hg vs. CMAQ-Hg 40
HYSPLIT 1996 Different Time Periods and Locations, but Similar Results ISC: 1990-1994 42
Model Intercomparisons • EMEP MSC-East (~7 models) • HYSPLIT-Hg vs. ISC • HYSPLIT-Hg vs. CMAQ-Hg 43
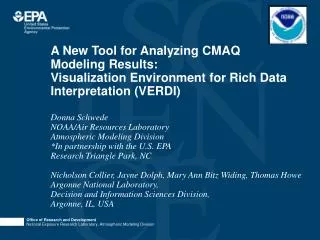
CMAQ-Hg results from EPA analysis performed for the Clean Air Mercury Rule Modeled Mercury Deposition in the Great Lakes Region from all sources during 2001 Modeled Mercury Deposition in the Great Lakes Region attributable to U.S. coal-fired power plants during 2001 44
Model-estimated U.S. utility atmospheric mercury deposition contribution to the Great Lakes: HYSPLIT-Hg (1996 meteorology, 1999 emissions) vs. CMAQ-HG (2001 meteorology, 2001 emissions). 45
Model-estimated U.S. utility atmospheric mercury deposition contribution to the Great Lakes: HYSPLIT-Hg (1996 meteorology, 1999 emissions) vs. CMAQ-Hg (2001 meteorology, 2001 emissions). • This figure also shows an added component of the CMAQ-Hg estimates -- corresponding to 30% of the CMAQ-Hg results – in an attempt to adjust the CMAQ-Hg results to account for the deposition underprediction found in the CMAQ-Hg model evaluation. 46
Outline of Presentation • modeling methodology • some preliminary results for Mobile Bay (based on this methodology) • model intercomparisons • summary of previous work; current goals; challenges 47