Download
1 / 34
340 likes | 554 Vues
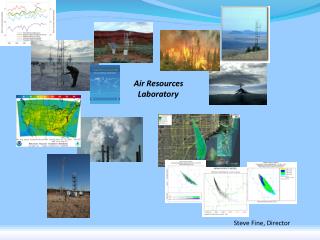
Atmospheric Mercury Research Mark Cohen Air Resources Laboratory ARL Laboratory Review May 3-5, 2011. Context. Provide sound scientific information on the emission, dispersion, transformation, and air-surface exchange of atmospheric mercury compounds

E N D
Atmospheric Mercury Research Mark Cohen Air Resources Laboratory ARL Laboratory Review May 3-5, 2011
Context • Provide sound scientific information on the emission, dispersion, transformation, and air-surface exchange of atmospheric mercury compounds • Measure and understand spatial and temporal trends in air concentrations and air-surface exchange • Provide robust source-attribution information for atmospheric mercury deposition to sensitive ecosystems, to inform policies to reduce loadings • Mercury exposure via fish consumption is an important public health concern • NOAA has a primary stewardship responsibility for the nation’s fisheries • Atmospheric emissions and subsequent deposition is a significant pathway through which mercury contamination enters sensitive aquatic ecosystems Goals Air Resources Laboratory
Mercury: Measurements and Modeling MODELING MEASUREMENTS Modeling used to aid in data interpretation and measurement planning speciated atmospheric mercury back trajectories comprehensive fate and transport other air pollutants, e.g., SO2, O3, CO wet deposition air-surface exchange Measurements used for model evaluation and improvement source-attribution for deposition Air Resources Laboratory
Polar-specific air-chemistry can lead to enhanced mercury deposition under some conditions mercury from global atmospheric pool entering North America mercury that doesn’t deposit continues its global circulation regional and and global sources contribute to atmospheric mercury deposition North American mercury sources * Atmospheric mercury deposition varies spatially and temporally, and is always a complex combination of impacts from local, regional, national, and global emissions sources. Thousands of fish-advisories throughout North America due to mercury contamination Air Resources Laboratory
Different “forms” of mercury in the atmosphere • Elemental Mercury -- Hg(0) • most of total Hg in atmosphere • doesn’t easily dry or wet deposit • globally distributed • Elemental Mercury -- Hg(0) • most of total Hg in atmosphere • doesn’t easily dry or wet deposit • globally distributed ? • Reactive Gaseous Mercury -- RGM • a few % of total atmos. Hg • oxidized Hg (HgCl2, others) • very water soluble and “sticky” • bioavailable • Reactive Gaseous Mercury -- RGM • a few % of total atmos. Hg • oxidized Hg (HgCl2, others) • very water soluble and “sticky” • bioavailable • Particulate Mercury -- Hg(p) • a few % of total atmos. Hg • Hg in/on atmos. particles • atmos. lifetime 1~ 2 weeks • bioavailability? • Particulate Mercury -- Hg(p) • a few % of total atmos. Hg • Hg in/on atmos. particles • atmos. lifetime 1~ 2 weeks • bioavailability? ? Air Resources Laboratory
Measurements – Approaches • Long-Term Monitoring • Process Studies / Field Intensives Air Resources Laboratory
Measurement Approach – Long-Term Monitoring Emissions (kg/yr) Allegheny Portage 5-10 10-50 50-100 100–300 300–500 Mauna Loa 500–1000 1000–3500 Beltsville Canaan Valley Type of Emissions Source coal-fired power plants other fuel combustion waste incineration metallurgical Grand Bay NERR manufacturing & other Four ARL long-term mercury measurement sites in the continental U.S., one in Hawaii; 2002 mercury emissions sources based on data from USEPA, Envr. Canada and the CEC Air Resources Laboratory
Long-Term Monitoring Examples Grand Bay NERR precipitation collection Mercury Deposition Network and heavy metals Canaan Valley precipitation amount major ions (“acid rain”) ultrasonic anemometer for wind turbulence elemental mercury sampling inlets at different heights to measure vertical gradient -- to estimate net surface exchange flux mercury & trace gas monitoring tower (10 meters) RGM and Hg(p) collectors top of tower with two sets of RGM and Hg(p) collectors Air Resources Laboratory
Mauna Loa Observatory, Hawaii: since January 2011 Research Question:What is the reason for the dramatically higher reactive gaseous mercury (RGM) concentrations at Mauna Loa (in the free troposphere) -- relative to typical concentrations at low elevation sites? 3,397 m ASL • down-slope flow from the free troposphere at night • ideal location to study atmospheric mercury chemistry at a high-altitude, remote location Reactive Gaseous Mercury (pg/m3) Air Resources Laboratory
NOAA-led measurement Co-located measurement Measurements – Summary Air Resources Laboratory
Measurement Approach – Process Studies / Field Intensives …the first estimates of the mercury balance and cycling for the Antarctic polar plateau • Arctic, Antarctic, Grand Bay, Beltsville, Houston, Ann Arbor, Nevada, … • Generally large, multi-investigator studies, including method development, inter-comparision and optimization • Measurements of: • Concentrations of different forms of mercury and other key species, at the surface and aloft, using active and passive techniques • Surface exchange using micrometeorological and surrogate- surface techniques (see Steve Brooks’ poster regarding polar mercury studies) Weekly averages of filterable Hg (discrete points) and the solar elevation angle at South Pole Station from 2003 to 2006. The peak annual filterable Hg lags the solar maximum by 3–4 weeks. Steve Brooks, NOAA – ARL, Barrow Alaska Air Resources Laboratory
Process Studies / Field Intensives Grand Bay (MS) Field Intensive July-Aug 2010, April-May 2011 Launching an ozonesonde to collect ozone & meteorological data Univ. of Tenn. Space Inst. plane for air measurements Surface RGM and SO2 at the Grand Bay NERR site during the August 2010 intensive • Investigating the roles of: • halogen chemistry in the marine layer and free troposphere • transport from upper atmos. • local/regional emissions • Measurements at surface and aloft • 2nd phase ongoing now • see Winston Luke’s poster SO2 (ppb) RGM (pg/m3) Julian Day 2010 Air Resources Laboratory
Measurements – Accomplishments • long term, high-quality data • atmospheric chemistry • trend analysis • local vs. long-range transport • source-receptor studies • model evaluation Inside the instrument trailer at the Grand Bay NERR long term mercury monitoring site Air Resources Laboratory
Measuring RGM (reactive gaseous mercury) is important and challenging; two co-located speciated mercury measurement instruments provide continuous “coverage” and allow peaks to be verified Date Air Resources Laboratory
Measurements – Accomplishments • long term, high-quality data • atmospheric chemistry • trend analysis • local vs. long-range transport • source-receptor studies • model evaluation • method development • improved accuracy, operational robustness • reduction of sample bias, artifact losses • advances in scientific understanding • Polar mercury dynamics • dry deposition Inside the instrument trailer at the Grand Bay NERR long term mercury monitoring site Air Resources Laboratory
Measurements – Indicators of Success • Peer-reviewed publications (e.g., Atmos. Environ., Geophys. Res. Letters) • Funding from other agencies (e.g., EPA, NSF) • Founding member and key contributor to the Atmospheric Mercury Monitoring Network (AMNet) • Data • Methods • Data analysis Allegheny Portage Beltsville (2) Canaan Valley Mauna Loa Grand Bay (2) NOAA-ARL sites contributing to the Atmospheric Mercury Monitoring Network (AMNet), an emerging speciated mercury air concentration network Air Resources Laboratory
Measurements – Collaborators Universities and Institutes • Canaan Valley Institute • Florida State University • University of Houston • University of Maryland • University of Tennessee Space Institute • University of Miami (Florida) • Georgia Tech University • Mississippi State University • Jackson State University • University of Michigan • University of Nevada • University of Illinois • Valparaiso University NOAA • Grand Bay National Estuarine Reserve (NERR) • Nat’l Centers for Coastal & Ocean Science (NCCOS) • Earth Systems Research Laboratory (ESRL) • National Weather Service (NWS) • Sea Grant • Environmental Research Program (ERP) Other Federal Agencies • EPA Clean Air Markets Division (CAMD) • Fish and Wildlife Service • Department of Agriculture • National Park Service • National Science Foundation • U.S. Geological Survey Industry • TEKRAN • Electric Power Research Institute • Southern Company State/Local Governments • Maryland, Mississippi, Pennsylvania, Texas, Alaska, Virginia, West Virginia Air Resources Laboratory
Measurements – Future Directions • Optimize existing measurement methods • Develop new methods, e.g., • laser-based eddy correlation system • relaxed-eddy-accumulation (REA) system • surrogate surfaces as low cost, simple devices for oxidized mercury concentrations and dry deposition estimates • Additional measurements at long-term sites • Publication and additional analysis of datasets • Field intensives involving process studies to address key uncertainties • Assess effects of forest fires and floods on ecosystem mercury loads • Assess the potential impacts of climate change on polar mercury oxidation, deposition, and glacial sequestration Air Resources Laboratory
Modeling – Approaches • Back-trajectory analyses with HYSPLIT • Fate and transport modeling with HYSPLIT-Hg …focus on source-receptor relationships Air Resources Laboratory
Back Trajectory Analysis – Episodes Beltsville, Maryland mercury site Reactive Gaseous Mercury episode Air Resources Laboratory
Baltimore Chesapeake Bay Washington D.C. Air Resources Laboratory
Back Trajectory Analysis – “Gridded Trajectory Frequencies” • When measured concentrations at a given site are relatively high (or low), where do the air masses arriving at the site tend to come from? • Are these regions related – or not – to known mercury sources? • An extension of trajectory cluster analysis • What fraction of trajectories for a given subset of measurements (e.g., top 10% of RGM measurements) pass through each grid square throughout a given domain? • How does this geographical “trajectory gridded frequency” pattern compare with locations of known mercury air emissions sources? Instead of single-event analysis, a way to analyze a more extensive data record at a given site RGM (pg/m3) One year of hourly reactive gaseous mercury (RGM) measurements at the Piney Reservoir site in Western Maryland, courtesy of Mark Castro, Univ. of Maryland Air Resources Laboratory
Piney Measurement Site Where the air at the Piney Reservoir site tended to come from -- on average -- over the entire year Percent of back-trajectories passing through grid square 0 - 1 6 – 10 10 - 100 1- 3 3 - 6 Air Emissions size/shape of symbol denotes amount of mercury emitted (kg/yr) 5 - 10 10 - 50 50 - 100 100 – 300 300 - 500 500 - 1000 1000 - 3500 color of symbol denotes type of mercury source coal-fired power plants other fuel combustion waste incineration metallurgical manufacturing & other 0.1 degree lat/long regional grid
Piney Measurement Site Difference between selected case and total year in percent of back-trajectories passing through grid square Where the air tended to come from when the measured RGM at the Piney Reservoir site was HIGH > 2.5 < -2.5 2 – 2.5 -2.5 to -2 1.5 - 2 -2 to -1.5 1 to 1.5 -1.5 to -1 The yellow and orange grid squares are areas where the trajectories pass more often than the “average” for the entire year The purple grid squares represent areas where the trajectories pass less often than the “average” for the entire year 0.5 - 1 -1 to -0.5 0 to 0.5 -0.5 to 0 Air Emissions size/shape of symbol denotes amount of mercury emitted (kg/yr) 5 - 10 10 - 50 50 - 100 100 – 300 300 - 500 500 - 1000 1000 - 3500 color of symbol denotes type of mercury source coal-fired power plants other fuel combustion waste incineration metallurgical manufacturing & other 0.1 degree lat/long regional grid
Piney Measurement Site Difference between selected case and total year in percent of back-trajectories passing through grid square Where the air tended to come from when the measured RGM at the Piney Reservoir site was LOW > 2.5 < -2.5 2 – 2.5 -2.5 to -2 1.5 - 2 -2 to -1.5 1 to 1.5 -1.5 to -1 The yellow and orange grid squares are areas where the trajectories pass more often than the “average” for the entire year The purple grid squares represent areas where the trajectories pass less often than the “average” for the entire year 0.5 - 1 -1 to -0.5 0 to 0.5 -0.5 to 0 Air Emissions size/shape of symbol denotes amount of mercury emitted (kg/yr) 5 - 10 10 - 50 50 - 100 100 – 300 300 - 500 500 - 1000 1000 - 3500 color of symbol denotes type of mercury source coal-fired power plants other fuel combustion waste incineration metallurgical manufacturing & other 0.1 degree lat/long regional grid
Modeling – Comprehensive Fate and Transport Simulations • Start with an emissions inventory • Use gridded meteorological data • Simulate the dispersion, chemical transformation, and wet and dry deposition of mercury emitted to the air • Source-attribution information needed at the end, so optimize modeling system and approach to allow source-receptor information to be captured • HYSPLIT-Hg developed over the last ~10 years with specialized algorithms for simulation of atmospheric mercury Air Resources Laboratory
Modeling – Accomplishments Total Gaseous Mercury (ng/m3) at Neuglobsow, Germany, June 26 – July 6, 1995. Successful performance in model evaluation and model intercomparison exercises model inter-comparison and evaluation carried out in collaboration with numerous mercury modeling research groups around the world, under the auspices of EMEP (Europe) Ryaboshapko et al., Intercomparison study of atmospheric mercury models: 1. Comparison of models with short-term measurements. Science of the Total Environment376, 228-240, 2007. Air Resources Laboratory
Modeling – Accomplishments Policy-Relevant Scenario Analysis Atmospheric Deposition Flux to Lake Michigan from Anthropogenic Mercury Emissions Sources in the U.S. and Canada (g Hg/km2-year) Air Resources Laboratory
Modeling – Accomplishments But these “local” emissions are responsible for a large fraction of the modeled atmospheric deposition Only a small fraction of U.S. and Canadian emissions are emitted within 100 km of Lake Michigan Emissions and deposition to Lake Michigan arising from different distance ranges away from the lake (km) (based on 1999 anthropogenic emissions in the U.S. and Canada) Air Resources Laboratory
When puffs grow to sizes large relative to the meteorological data grid, they split, horizontally and/or vertically In the new version of HYSPLIT (4.9), puffs are “dumped” into an Eulerian grid after a specified time (e.g., 96 hrs), and the mercury is simulated on that grid from then on… Modeling – Accomplishments Ok for regional simulations, but for global modeling, puff splitting overwhelms computational resources Air Resources Laboratory
Modeling – Indicators of Success • Peer-reviewed publications, e.g., NOAA Report to Congress on Mercury Contamination in the Great Lakes • Good performance in model intercomparison and model evaluation exercises • Awarded grants to carry out modeling analysis, e.g., Great Lake Restoration Initiative • Frequent invitations to provide guidance on regulatory, legislative, and judicial issues • Examples of impact on decisions include: • Mercury regulations enacted by Pennsylvania • Debate over the Clean Air Mercury Rule (CAMR) related to the “hotspots” issue Air Resources Laboratory
Modeling – Collaborators Universities and Institutes • University of Maryland • Jackson State University • Cornell University • Syracuse University • Clarkson University • Harvard University • Texas Christian University • University of Michigan • University of Washington • Lake Champlain Research Consortium NOAA • National Weather Service (NWS) • Environmental Modeling Program • Ecosystem Research Program Other Federal Agencies and Programs • EPA Clean Air Markets Division (CAMD) • Great Lakes Restoration Initiative (GLRI) • EPA Office of Research and Development • EPA Great Lakes National Program Office • US Geological Survey • National Atmospheric Deposition Program International Agencies and Organizations • International Joint Commission (IJC) • Commission for Environmental Cooperation (CEC) • Environment Canada • Instituto Nacional de Ecología (INE-Mexico) • Meteorological Synthesizing Centre - East (Russia) • United Nations Environmental Program (UNEP) • Arctic Monitoring & Assessment Program (AMAP) • Norwegian Institute for Air Research (NILU) State/Local Governments • Pennsylvania, Florida, Mississippi, Maryland • Gulf of Mexico Alliance (Florida, Texas, Mississippi, Alabama, Louisiana) Industry • Electric Power Research Institute • Southern Company Air Resources Laboratory
Modeling – Future Directions • Improve model physics & chemistry as new info. becomes available • Further development of global modeling capability • “particle-mode” dispersion simulation for HYSPLIT-Hg • Improve treatment of natural sources, surface exchange, and re-emissions • Multi-media: incorporate surface layers into model Science • Continue/extend Great Lakes analysis (Great Lakes Restoration Initiative) • Continue/extend Gulf of Mexico analysis; link with ecosystem model • Continue/extend numerous collaborations (EPA, State TMDL’s, …) • Participate in model intercomparisons • Episode-focused model evaluation at sites • Long-term model evaluation at sites Policy- Relevant Analysis Model Evaluation ARL’s mercury research represents a rare opportunity to combine modeling, measurements, and meteorological data/modeling Air Resources Laboratory
Questions? View from the monitoring tower at the Grand Bay NERR long-term mercury monitoring site Air Resources Laboratory