Download
1 / 40
400 likes | 590 Vues
E x p e r i m e n t s (c o n t .) C o n t e n t A n a l y s i s. COMM 420.8 Fall 2007 Nan Yu. Factorial Design (Multiple IVs Design). more than one independent variable (IV). IV ’ s are called “ factors ”. Factorial Design (Multiple IVs Design).

E N D
Experiments (cont.) Content Analysis COMM 420.8 Fall 2007 Nan Yu
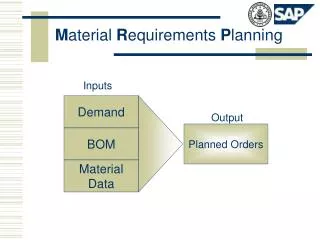
Factorial Design (Multiple IVs Design) • more than one independent variable (IV). • IV’s are called “factors”
Factorial Design (Multiple IVs Design) • E.g., Imagine that you would like to study the effect of advertising (IV1) and provision of product sample (IV2) on purchase intention (DV) • Both IVs have to be manipulated and DV has to be measured IV 1 Advertising DV Purchase intention IV 2 Provision of Product Sample
Factorial Design (Multiple IVs Design) Advertising Purchase intention Provision of Product Sample • 2 (advertising) x 2 (provision of product sample) factorial design • 2 (advertising) = Exposed to ad, Not exposed to ad • 2 (provision of product sample) = Product sample available, Product sample not available • Purchase intention I don’t want to buy it I really want to buy it. 1 2 3 4 5 6 7 • What level measurement are the IVs and DV? • Nominal/ Ordinal/ Interval/ Ratio
Groups in Factorial Design • Group 1 • No advertising, no sample (control group) • Group 2 • Sample only, no advertising • Group 3 • Advertising only, no sample • Group 4 • Both sample and advertising (Watt and van der Berg, 2002)
Main effects and interaction effects • Main effects • The effect of one IV is not depending on the levels of the other IV. • Interaction effects • The effect of one IV is depending on the levels of the other IV.
Factorial Design Normal Dilated Female Male
Interaction Demo • Please go to folder week 7 on ANGEL • Download the file “interaction demo”
Computer Anthropomorphism(Koh & Tsay, 2006) • IV1: Anthropomorphizing a computer (named computer vs. unnamed computer) • IV2: Physical proximity between the user and computer (far vs. near) • IV3: Reciprocity of the computer (good score vs. bad score) • DV: Politeness towards the computer How many factors are in this study? What kind of factorial design is it? How many experimental groups do we need? If each group needs to have 20 people, how many of participants should the study recruit? 2X2X2 factorial design, 160 people
Computer Anthropomorphism(Koh & Tsay, 2006) • 2 (Anthropomorphism) x 2 (Physical Proximity) x 2 (Reciprocity) Experimental Design RECIPROCITY Good Score Bad Score Cells PHYSICAL PROXMITY Near Computer Far from Computer Near Computer Far from Computer Named Computer ANTHROPOMORPHISM Unnamed Computer
Computer Anthropomorphism(Koh & Tsay, 2006) 2 (Anthropomorphism) x 2 (Physical Proximity) • DV: Politeness toward the computer • Interaction effects Politeness towards the computer Away from the computer Near the computer Named Computer Unnamed Computer
More Examples • If a factorial experiment is: • 2 x 2 Number of factors? Number of levels per factor? Number of groups? • 2 x 3 x 2 Number of factors? Number of levels per factor? Number of groups? • If you have only 1 factor with 3 levels, you can call it 1X3 experimental design.
Adv & Disadv of Factorial Designs • Advantages – • Combined effect of multiple variables • Disadvantages – • Increases number of participants/subjects • Increases time needed to conduct the experiment
Field Experiment • Researcher retains control over IVs, but conducts the research in a natural setting, without any control over environmental influences. • E.g., Imagine that you are a researcher who is employed by a large corporation. You are interested in the ability of a communication training program to reduce communication anxiety in people who must make speeches. • Hypothesis Those who receive communication training will have reduced levels of communication anxiety compared to those who did not receive communication training.
Field Experiment Example Both groups fill out a questionnaire assessing communication anxiety (operationalized as apprehension immediately before giving his or her most recent presentation) RECEIVES TRAINING PROGRAM GROUP 1 Sampling Frame: List of all employees of the organization Randomly assigned to one of two groups Anxiety GROUP 2 DOES NOT RECEIVE TRAINING PROGRAM
Several months later… GROUP 1 RECEIVES TRAINING PROGRAM Treatment Group Anxiety GROUP 2 Each group fills out the same questionnaire DOES NOT RECEIVE TRAINING PROGRAM Control Group
Comparing Posttest Measures POSTTEST MEASURES GROUP 1 RECEIVES TRAINING PROGRAM COMMUNICATION ANXIETY OF GROUP 1 Treatment Group Comparing the mean scores of communication anxiety, which group needs to be significantly greater to support the hypothesis? Q GROUP 2 DOES NOT RECEIVE TRAINING PROGRAM COMMUNICATION ANXIETY OF GROUP 2 Control Group
Field Experiment: Benefits vs. Costs • Benefits • Increases external validity (due to natural setting) • Nonreactivity (Little influence of a subject’s awareness of being measured or observed on his/her behavior) • Can examine complex social processes and situations (more informative) • Inexpensive (as compared to lab experiments) in most cases (depending on size and scope) • Costs • Ethical considerations need to be taken into account • External hindrances in the environment • Little control over extraneous variables (as compared to lab experiments)
Observational Research • Sometimes, the researcher has no means to manipulate the IVs • There are instances in which s/he can control neither the IV nor the research setting. • E.g.1 Retrospective studies: Researcher is interested in how past events from childhood influence present behavior of adults • In this case, the researcher is limited to observing (variations in IV), i.e. measuring instead of manipulation.
Content Analysis • Survey and experiments try to discover similar/different patterns among people. • Content analysis try to observe the messages in the media – the pattern, the trend and the problems.
Content Analysis • Systematic study of communication contents in an objective and quantitative manner. • The researcher uses objective and systematic counting and recording procedures to produce a quantitative description of the symbolic content in a text. • Why do we need content analysis?
Applications of content analysis • Describing communication content • Testing hypothesis of message characteristics • Assessing the image of particular groups in society. • Comparing media content to “real world” • Establishing starting point for media effects research, (e.g. cultivation and agenda setting)
Content Analysis • The content refers to words, meanings, pictures, symbols, ideas, themes, any message that can be communicated, etc. • The text refers to anything written, visual, or spoken that serves as a medium for communication (e.g., books, newspapers and newspaper articles, advertisements, speeches, official documents, movies, musical lyrics, photographs, etc.)
Content Analysis • Uses nonreactive measures and it is a type of unobtrusive research • Unobtrusive research is conducted in such a way that people being studied are not aware of it, and therefore they behave more “naturally” • Therefore, the measures are not reactive (i.e., participants are not reacting against the research procedures, settings, etc.)
Steps in Content Analysis • 1. Research topic/set up parameter • 2. Sampling • 3. Codebook/Intercoder reliability • 4. Coding • 5. Analyze the pattern of the data • 6. Results/Conclusions
Coding and measurement • Measurement (coding) in content analysis uses structured observation: systematic, careful observation based on written rules. • The rules explain how to categorize and classify the observations (i.e., units). • Written rules are important in content analysis, as they improve the reliability and make the replication possible.
Intercoder reliability • In order to improve the reliability and eliminate differences in judgments, researchers train and use more than one coder. • If they agree most of the time on what unit should be placed in which category, the reliability is high. • This type of reliability is called intercoder or interrater reliability.
Intercoder reliability • There are a number of ways to compute intercoder reliability (depend on the level of measurement of the content categories). • Generally, the percent agreement for a good set of content categories should be above 90%. • Poor reliability may indicate: • Content categories are poorly defined or are too general. • Content coders are not well trained.