Impact of Esomeprazole on Autophagic Flux and Lysosomal Function in Melanoma Cells
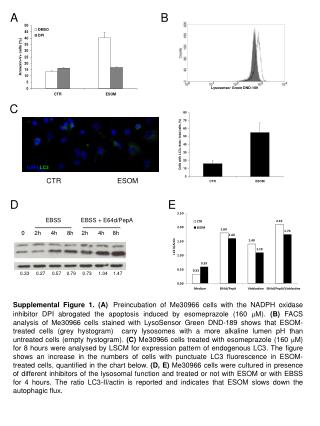
This study investigates the effects of Esomeprazole (ESOM) on the apoptosis and autophagic flux in Me30966 melanoma cells. Using the NADPH oxidase inhibitor DPI, we found that preincubation inhibited apoptosis induced by ESOM (160 mM). FACS analysis with LysoSensor Green DND-189 indicated that ESOM-treated cells exhibit more alkaline lysosomal pH. Additionally, LSCM analysis revealed increased LC3 puncta in cells treated with ESOM for 8 hours, revealing that ESOM slows down autophagic flux when various lysosomal inhibitors are introduced.

Impact of Esomeprazole on Autophagic Flux and Lysosomal Function in Melanoma Cells
E N D
Presentation Transcript
Lysosensor Green DND-189 ESOM CTR DAPILC3 A B EBSS EBSS + E64d/PepA 0 2h 4h 8h 2h 4h 8h C D E 0.33 0.27 0.57 0.79 0.73 1.04 1.47 Supplemental Figure 1. (A)Preincubation of Me30966 cells with the NADPH oxidase inhibitor DPI abrogated the apoptosis induced by esomeprazole (160 mM). (B) FACS analysis of Me30966 cells stained with LysoSensor Green DND-189 shows that ESOM-treated cells (grey hystogram) carry lysosomes with a more alkaline lumen pH than untreated cells (empty hystogram). (C) Me30966 cells treated with esomeprazole (160 mM) for 8 hours were analysed by LSCM for expression pattern of endogenous LC3. The figure shows an increase in the numbers of cells with punctuate LC3 fluorescence in ESOM-treated cells, quantified in the chart below. (D, E) Me30966 cells were cultured in presence of different inhibitors of the lysosomal function and treated or not with ESOM or with EBSS for 4 hours. The ratio LC3-II/actin is reported and indicates that ESOM slows down the autophagic flux.
siCTR siBeclin-1 siAtg5 300 mm A siBECN-1 5 nM siBECN-1 2 nM siATG5 5 nM siATG5 2 nM siSCR 5 nM siSCR 5 nM siSCR 2 nM siSCR 2 nM Interferin Interferin Atg5 Beclin-1 b-actin b-actin B C D Supplemental Figure 2.A) Knock-down of ATG5 and BECN1 expression was assessed by WB analysis in WM793 cells. B) The effects of Atg5 and Beclin-1 knockdown by siRNA on cell death is shown on Me30966 cells treated with ESOM (160 mM). C) Clonogenic survival assay performed on three melanoma cell lines treated with ESOM (160 mM) for 24 hours. Colonies were counted 15 days after removing dead cells. D) Analysis of basal autophagy levels in colonies collected at the end of the clonogenic survival assay. Basal autophagy is expressed as the ratio of LC3-II/actin detected by WB.