Understanding Stochastic Simulations for Robust Statistical Analysis
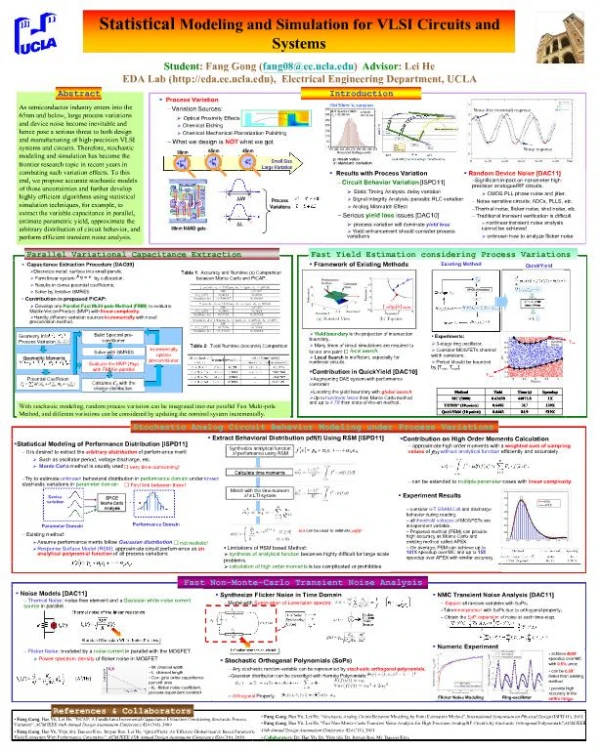
This article explores the importance of stochastic simulations in evaluating statistical tests, such as t-tests, when variances between groups are unequal. It discusses how these simulations better represent real-world dynamics, which are inherently stochastic. Key concepts include process variability, measurement error, and model uncertainty. The piece features a practical example using a spreadsheet to illustrate where process, measurement, and modeling errors can enter simulations. By adopting management strategies based on these simulations, we can achieve robust outcomes in unpredictable environments.

Understanding Stochastic Simulations for Robust Statistical Analysis
E N D
Presentation Transcript
Why Do Stochastic Simulations? • Empirical evaluation of statistical tests or methods • Want to know how well t-test performs when have unequal variances between groups • “Better” represent system dynamics • Real world appears stochastic • Develop management strategies that are robust to variability • Fun
Sources of Stochasticityor Uncertainty • Measurement error • Variance • “True” error or bias • Process variability • Dynamic rates are variable • Model Uncertainty • Walk through spreadsheet example
Where Does Process Error Enter the Model? dPrey (K – Prey) -------- = Prey * r * ------------- dt K dPrey (K – Prey) -------- = Prey * rt * ------------- dt K rt ----> Implies that r varies over time
Where Does Measurement Error Enter the Model? dPrey (K – Prey) -------- = Prey * r * ------------- dt K Observed Prey = Actual Prey + error Key is that the observed prey abundance does not enter into differential equation – at least in concept. In practice, it may have to if that is the only measure we have.
Where Does Modeling Error Occur? dPrey (1000 – Prey) -------- = Prey * r * ----------------- dt 1000 dPrey (1500 – Prey) -------- = Prey * r * ----------------- dt 1500 dPrey (K – Prey) -------- = Prey * r * ------------- - a*Predator dt K
Basic Concepts • Discrete random variables • Probability mass function f(x) x
Basic Concepts • Continuous random variables • Probability density function f(x) x
Basic Concepts • Cumulative Distribution Function f(x) x 1.00 F(x) x
Basic Concepts • Expected values If c is a constant and X and Y are random variables E(cX) = c E(X) E(c+X) = c + E(X) E(X + Y) = E(X) + E(Y) E(XY) = E(X) E(Y) if X and Y are independent E(XY) ≈ Note that in general, E(f(X)) ≠ f(E(X)) eg., E(ln(X)) ≠ ln(E(X))
Basic Concepts • Variance If c is a constant and X and Y are random variables Var(cX) = c2 Var(X) Var(c+X) = Var(X) Var(X + Y) = Var(X) + Var(Y) if X and Y are independent Var(X - Y) = Var(X) + Var(Y) if X and Y are independent Var(X + Y) = Var(X) + Var(Y) + 2Cov(X,Y) Var(X - Y) = Var(X) + Var(Y) - 2Cov(X,Y) if X and Y are independent Var(XY) ≈ (E(X))2Var(Y) + (E(Y))2Var(X) – Var(X)Var(Y)
Basic Concepts Using these principles – can shift mean and variance To get “target” values Example – Generate N(0,1), but want N(5,9) 1st multiply each value by 3 – this gives you a variance of 9 2nd add 5 to each value – this shifts mean from 0 to 5 Generally – want to multiply first to get target variance and Secondly add value to shift mean. If try to do in reverse order, you may shift the mean when you multiply if the Mean is not 0