Download
1 / 57
570 likes | 684 Vues
Neutral Hydrogen Gas in Star Forming Galaxies at z=0.24. Philip Lah. HI Survival Through Cosmic Times Conference. Collaborators: Frank Briggs (ANU) Jayaram Chengalur (NCRA) Matthew Colless (AAO) Roberto De Propris (CTIO) Michael Pracy (ANU) Erwin de Blok (ANU). Talk Outline.

E N D
Neutral Hydrogen Gas in Star Forming Galaxies at z=0.24 Philip Lah HI Survival Through Cosmic TimesConference
Collaborators:Frank Briggs (ANU) Jayaram Chengalur (NCRA) Matthew Colless (AAO)Roberto De Propris (CTIO)Michael Pracy (ANU)Erwin de Blok (ANU)
Talk Outline StarForming Galaxies at z=0.24 • ‘Fujita sample’ of star-forming galaxies • HI mass content by ‘coadding’ • HI mass vs. star formation rate • radio continuum at z = 0.24 HI in Abell 370, a galaxy cluster at z=0.37
The Surprime-cam filters H at z = 0.24
The Suprime-Cam Field 24’ × 30’ Fujita et al. 2003 narrow band imaging - H emission at z=0.24 348 galaxies RA DEC
Cosmic Star Formation Rate Density Hopkins 2004
Cosmic Star Formation Rate Density Fujita et al. 2003 Hopkins 2004
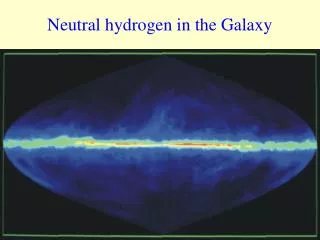
Why HI detection is hard z = 0.24 z=0.05
Radio Data Cube Frequency HI redshift DEC RA Coadding of HI Signals • pick out the HI signal using optical redshifts • coadd faint signals to make the measurement
2dF instrument multi-object, fibre fed spectrograph
Fujita galaxies - B filter thumbnails 10 arcsec 10 arcsec ordered by increasing H luminosity
Fujita galaxies – 2dF redshifts thumbnails 10 arcsec 10 arcsec ordered by increasing H luminosity 154 redshifts 121 useful
Galaxy Sizes To coadd the signal I need the galaxies to be unresolved. This allows me take the value in the radio data cube at the position and redshift of galaxy as the total HI flux.
Galaxy Sizes To coadd the signal I need the galaxies to be unresolved. This allows me take the value in the radio data cube at the position and redshift of galaxy as the total HI flux. Complication!! Many of the galaxies are larger than GMRT 2.9’’ synthesis beam.
Estimate of Galaxy HI Diameter Beam Smoothings Used relationship between optical size and HI size from Broeils & Rhee 1997
HI spectrum all neutral hydrogen gas measurement using 121 redshifts - weighted average MHI = (2.26 ± 0.90) ×109 M
Cosmic Neutral Gas Density vs. Redshift Rao et al. 2006 DLAs from MgII absorption Prochaska et al. 2005 DLAs Zwaan et al. 2005 HIPASS HI 21cm
Cosmic Neutral Gas Density vs. Redshift my new point
Cosmic Neutral Gas Density vs. Time my new point
Galaxy HI Mass vs Star Formation Rate HIPASS & IRAS data z ~ 0 Doyle & Drinkwater 2006
HI Mass vs Star Formation Rate at z = 0.24 line from Doyle & Drinkwater 2006
Problem at High Redshift • at z > 1 factor ~10 increase in cosmic star formation rate density • if the SFR-HI mass relation holds true would lead to factor of ~4 increase in cosmic neutral gas density • from damped Lyα systems see only a factor ~2 increase at high redshift (Prochaska et al. 2005) • change in star formation mechanism – efficiency increased by a factor ~2
Comparison of Star Formation Indicators at z 0 Sullivan et al. 2003 Sullivan et al. 2001
Comparison at z = 0.24 using all 348 gals 45 gals 55 gals 236 gals line from Sullivan et al. 2001
Galaxy Clusters Butcher-Oemler effect (1978) • with increasing redshift galaxy clusters show a higherfraction of optically blue galaxies (mostly bright spirals & irregulars) • effect noticeable from z0.1 • strong effect by z=0.4
Abell 370 Observations • radio observations with the GMRT of the galaxy cluster totalling ~34 hours at 1040 MHz (HI 21 cm at z = 0.37) • V, R & I band optical imaging using the SSO 40 inch telescope • spectroscopic follow-up using AAOmega on the Anglo-Australian Telescope for 4 nights for optical redshifts
Abell 370: RA & DEC GMRT Beam Blue V-I colour 0.9 Red V-I colour > 0.9 the galaxies are large - luminosities L* or greater
HI gas measurement 278 redshifts MHI = (7.4 ± 2.6) ×109 M Signal to Noise = 2.8 Abell 370: all
Abell 370: blue and red Blue Galaxies 128 redshifts MHI = (10.1 ± 4.1)×109 M Signal to Noise = 2.5 Red Galaxies 150 redshifts MHI = (5.5 ± 3.4)×109 M Signal to Noise = 1.6
Conclusions • HI 21cm emission is observable at moderate redshifts using the coadding technique • the measured cosmic neutral gas density at z=0.24 is consistent with that from damped Lyα • the radio continuum-Hα & SFR-HI mass correlations both hold at z=0.24 suggests that the process of star formation in field galaxies is not significantly different ~3 Gyr ago • there is large amounts of HI gas at z=0.37 in galaxies within clusters and the gas is concentrated in the blue galaxies
HI mass function HIPASS out to z~0.042 Zwaan et al. 2005
Histogram of Redshifts Redshift histogram GMRT HI freq range Subaru Narrow Band Filter 154 redshifts 121 useful
Why use GMRT? • GMRT collecting area 21 × ATCA 6.9 × WSRT 3.6 × VLA • frequency coverage & bandwidth • angular resolution • position at low latitude