Download
1 / 28
290 likes | 355 Vues
Explore gas fluxes between atmosphere and ocean, including factors influencing flux rates and carbon cycle processes affecting CO2 exchange. Learn about the challenges in direct gas flux measurements and modeling accuracy in understanding climate change.

E N D
Air-Sea Exchange : 2 SOEE3410 : Lecture 5 Ian Brooks
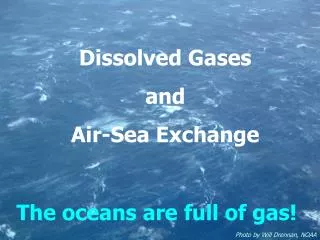
Gas fluxes depend upon: Strength of mixing (u*, z0) Concentration in ocean Concentration in atmosphere Molecular diffusion in interfacial sub-layer. Concentration in ocean depends upon: solubility of the gas in water (temperature dependent) Reactions with other chemical species Biological processes Gas flux is driven by the difference in partial pressure of the gas between atmosphere and ocean. Direct measurement of gas fluxes can be difficult: need for fast, accurate measurement in hostile environments. turbulent fluctuations often very small compared to mean value (eg CO2) Gas Fluxes SOEE3410 : Atmosphere & Ocean Climate Change Processes
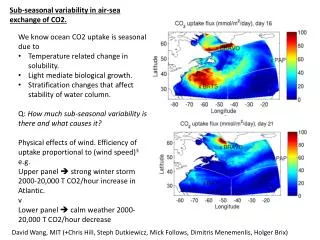
CO2 in Ocean Water The concentration of CO2 dissolved in ocean waters is dependent upon both chemical and biological processes. • Dissolved (non-ionic) CO2 makes up only ~1% of Dissolved Inorganic Carbon (DIC). This can be exchanged with CO2 in the atmosphere until the (local) partial pressures in atmosphere and ocean are equal. • Bicarbonate ion, HCO3-, makes up 91% of DIC. • Carbonate ion, CO32-, makes up 8% of DIC. These three components are linked via the equilibrium of: CO2 + H2O + CO32- 2HCO3- SOEE3410 : Atmosphere & Ocean Climate Change Processes
The partial pressure of CO2 dissolved in water is strongly temperature dependent, increasing with temperature (solubility decreases). Thus regions of warming surface waters tend to be regions of out-gassing, while cooling waters are regions of uptake. Regions of warming and cooling are linked by large-scale ocean circulation, thus CO2 taken up in a cooling region can be released back to the atmosphere at a later time in a region of warming. SOEE3410 : Atmosphere & Ocean Climate Change Processes
Dissolved inorganic carbon is removed from surface waters via the production of CaCO3 by the formation of shells and corals. These ultimately form sediments on the sea bed. Ca2+ + CO32- CaCO3 Note that the removal of a carbonate ion drives the balance of DIC towards the production of dissolved non-ionic CO2, increasing its partial pressure in water. The formation of calcium carbonate thus both removes some carbon from the global CO2 cycle, and locally tends to force CO2 back into the atmosphere from the ocean. SOEE3410 : Atmosphere & Ocean Climate Change Processes
Direct measurements of pCO2 can be made only at spot locations. • Global ocean models successfully reproduce the main features of ocean carbon content: • Vertical gradient in DIC • Spatial patterns of surface pCO2: outgassing in tropics, uptake at higher latitudes • Models that include marine biology (DOC, plankton dynamics) also roughly reproduce seasonal cycle of surface pCO2, atmospheric O2 and surface chlorophyll. • Rough reproduction of phase and amplitude of interannual variability in equatorial Pacific SOEE3410 : Atmosphere & Ocean Climate Change Processes
There remain many aspects of marine carbon cycle that are not well simulated – poor understanding and representation of physical or biological processes • Spatial structure in deep ocean is poorly reproduced • Largest discrepancies where there are fewest measurements • Serious discrepancy in estimates of inter-hemisphere transport: all ocean models suggest zero transport – most observations suggest a transport of ~1 PgC/year! • Some recent observations closer to models…still an open question. SOEE3410 : Atmosphere & Ocean Climate Change Processes
Estimated pCO2 (ocean-air) for August and January. –ve values imply uptake to ocean, +ve values imply outgassing to atmosphere. SOEE3410 : Atmosphere & Ocean Climate Change Processes
Estimated annual air-sea CO2 flux SOEE3410 : Atmosphere & Ocean Climate Change Processes
Gas fluxes are usually parameterized in terms of a transfer velocity, kgas, where, kheat, the transfer velocity for heat is given by… Sc is the Schmidt number: the ratio of kinematic viscosity to the molecular diffusivity of the gas (Sc = /D 660 for CO2), Pr is the Prandtl number, the analageous quantity for heat (~7). Note terminology. In previous lecture a generic transfer velocity denoted by UT. K is more common symbol in gas transfer field SOEE3410 : Atmosphere & Ocean Climate Change Processes
The transfer velocity is a function of external forcing factors • Usually defined as a function of wind speed at 10 m (U10)(as for heat, water vapour) (remember Kheat = CDU10) • This simple parameterization cannot explain the observed variability in measured gas fluxes…other factors must be important Figure shows KCO2 values derived from measurements at sea, plotted against U10. Solid line is a best fit to the data, dashed lines are published parameterizations. From: Frew et al. 2004: Air-sea gas transfer: its dependence on wind stress, small-scale roughness and surface films. JGR, 109, C08S17. SOEE3410 : Atmosphere & Ocean Climate Change Processes
Various parameterizations of CO2 transfer velocity as a function of wind speed. Note large scatter at high wind speeds. (Woolf, 2005: Parameterization of gas transfer velocities and sea-state-dependent wave breaking. Tellus, 57B, 87-94.) SOEE3410 : Atmosphere & Ocean Climate Change Processes
Additional factors shown to affect gas transfer include: Wave fetch Boundary layer stability Presence of surfactants (films of biologically produced organic material) Bubble bursting These all modify both the surface small-scale wave field and subsurface turbulence, and hence the gas transfer velocity. Recent studies have shown that microscale breaking has a strong influence on air-sea gas exchange. Microscale breaking is associated with waves of wavelength ~0.1 to 0.5 m. Small vortices generated just behind the crest of the breaking wave enhance mixing just below the surface, renewing the surface sub-layer (i.e. the layer of water exchanging gas with the atmosphere) SOEE3410 : Atmosphere & Ocean Climate Change Processes
Fractional area coverage of region of thermal disruption by microbreakers, AB, is correlated with transfer velocities for heat (KH) and a trace gas (KG) AB is correlated with mean square slope – previously shown to correlate with KG Microscale breaking appeared to dominate gas transfer at low-moderate wind speeds Zappa et al. 2004: JGR, doi:10.1029/2003JC001897 Zappa et al. 2004 SOEE3410 : Atmosphere & Ocean Climate Change Processes
The mechanism by which wave breaking enhances gas transfer is still uncertain: Bubble mediated gas transfer: the transfer of dissolved gases between bubbles entrained below water surface and surrounding water is efficient due to large surface to volume ratio, and surface tension effects mean the pressure inside the bubble is greater than hydrostatic pressure for its depth gas can super saturate. On bursting at the surface sea-air transfer is greatly enhanced. Rising plumes of bubbles enhance turbulence in near-surface layer, increasing mixing on ocean side of interface Gas transfer due to wave breaking/bubble effects can be parameterized in terms of the fractional area of white-capping. Factors that affect whitecap fraction : Wind speed or wind stress (first attempts at parameterization depended only on U10) Wave height (a function of sea-state…how well developed are the waves…fetch dependent) Swell / waves propagating into region SOEE3410 : Atmosphere & Ocean Climate Change Processes
One of the most recent proposed parameterizations (Woolf, 2005) is: W is the whitecap fraction, u* is the friction velocity, H the significant wave height, and a the kinematic viscosity of air. RH is a form of Reynolds number for wind-waves. The bubble mediated gas transfer is expressed as the sum of transfer velocities for non-breaking (K0) and breaking processes (Kb) Modelled fractional whitecap cover as a function of wind speed and fetch (solid lines). (Woolf, 2005) The form of the breaking contribution is based on theoretical considerations, with constants derived from extensive observations both in laboratory wave tanks and in the field. SOEE3410 : Atmosphere & Ocean Climate Change Processes
Models LM : Liss & Merlivat (1986) N : Nightingale et al. (2000) W92 : Wanninkhof (1992) WM : Wanninkhof & McGillis (1999) Fetch (km): 10, 30, 100, 300, 1000 Woolf, 2005: Parameterization of gas transfer velocities and sea-state-dependent wave breaking. Tellus, 57B, 87-94. SOEE3410 : Atmosphere & Ocean Climate Change Processes
Although the basic processes that affect air-sea gas transfer are known, the detailed physics is only poorly understood. Most of the processes have yet to be measured in sufficient detail over a wide enough range of conditions to parameterize them in a manner usable in large-scale climate models. SOEE3410 : Atmosphere & Ocean Climate Change Processes
Aerosol Fluxes • Remote ocean regions have relatively clean air – low aerosol concentrations – compared to continental air masses. Remain important to climate because of very large spatial extent. • There are two primary sources of aerosol over the oceans: • Sea-salt : derived from evaporation of sea water droplets • Droplets formed by bubble bursting and ‘spume’ production – ripping of water droplet off wave crests by the wind • Non-sea-salt sulphates : derived from the oxidation of biologically produced gases, primarily from phytoplankton SOEE3410 : Atmosphere & Ocean Climate Change Processes
Bubble Bursting Bubbles injected into the ocean by wave-breaking (U > 4ms-1) rise to the surface and burst. The bubble film breaks up into 100s or 1000s of droplets <2m diameter. Following this, the bubble cavity collapses, as water flows in to fill the cavity a jet forms at its centre – this ejects a few (up to 7) larger drops ~2-100m in radius. A few 10s to 100 times as many film drops as jet drops form SOEE3410 : Atmosphere & Ocean Climate Change Processes
Spume production – water droplets are ripped from wave crests by the wind when U10 exceeds about 7 ms-1. Droplets range from ~40m to ~1mm in diameter. SOEE3410 : Atmosphere & Ocean Climate Change Processes
Droplets immediately begin evaporating. Largest droplets fall quickly back to surface and do not fully evaporate; smaller droplets can completely evaporate leaving behind a particle sea-salt, with mixed chemical composition – various salts and organic material. • Turbulence mixes the aerosol rapidly through the boundary layer, where they act as efficient Cloud Condensation Nuclei. SOEE3410 : Atmosphere & Ocean Climate Change Processes
Courtesy of Gerrit deLeeuw The uncertainty in sea spray aerosol generation as a function of wind speed is at least a factor of 10. Measurement to date has used indirect methods. Only recently has the technology to make direct measurements of the aerosol flux become available. SOEE3410 : Atmosphere & Ocean Climate Change Processes
U10 = 8 m s-1 U10 = 12 m s-1 SOEE3410 : Atmosphere & Ocean Climate Change Processes
MWS > 0.035 : undeveloped 0.03 < MWS < 0.035 : near developed MWS < 0.03 : well developed Mean fluxes (m-2 s-1 μm-1) 1.67×10⁵ (undeveloped) 2.45×10⁵ 5.08×10⁵ (well developed) Mean fluxes (m-2 s-1 μm-1) 37.2 (undeveloped) 55.5 42.5 (well developed) SOEE3410 : Atmosphere & Ocean Climate Change Processes
Biological Sources of Aerosol Over the remote ocean biological processes are a significant source of aerosol: • Phytoplankton emit the gas dimethylsuphide (DMS) • DMS is oxidized in the atmosphere via a complex chain of reactions with the hydroxyl radical (OH•), ozone (O3), hydrogen peroxide (H2O2),…to produce sulphuric acid, methane sulphonic acid and sulphur dioxide. These gases can condense to form aerosol particles (generically refered to as non-sea-salt-sulphate) that eventually grow large enough to act as CCN. • Newly formed nns-sulphate particles ~0.001m in size – too small to act as CCN. Further condensational growth or heterogeneous reactions required to produce larger particles. SOEE3410 : Atmosphere & Ocean Climate Change Processes
SurfaceHeat Flux AtmosphericStability Wind CoherentStructures Direction Wind Stress Fetch SurfaceFilms SurfaceFilms Microbreaking Waves TransferVelocityk NearSurfaceTurbulence Bubbles RemoteSensing Air-Sea Gas FluxF = kC Modelling C Biogeo-chemistry Sea SurfaceTemperature Hydrography SOEE3410 : Atmosphere & Ocean Climate Change Processes