Download
1 / 62
650 likes | 789 Vues
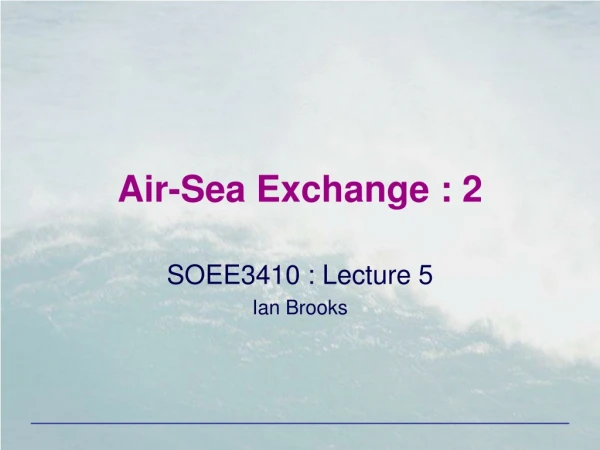
Air-Sea Exchange: science, politics, and challenges. by G. L. Geernaert Institute for Geophysics and Planetary Physics Los Alamos National Laboratory. A history focusing on wind drag. Outline. A few definitions Goals and customers Brief historical survey

E N D
Air-Sea Exchange: science, politics, and challenges by G. L. Geernaert Institute for Geophysics and Planetary Physics Los Alamos National Laboratory A history focusing on wind drag
Outline • A few definitions • Goals and customers • Brief historical survey • State of the art - focus on momentum • Opportunities and challenges
A few definitions • Air-sea exchange • Microscale processes which affect fluxes across the interface and/or characterize the nature of the interface • wind profiles, surface waves, heat flux, wind stress • mass fluxes (water, gas, aerosols, bacteria, etc.) • Atmosphere-ocean interaction • Dynamical interactions on the mesoscale and macroscale which are the results of microscale air-sea exchange • eddy states, fronts, boundary currents • oscillations (ENSO, NAO, etc.), climate, global change
Goals and customers of “air sea exchange” • Goal • Develop a sufficient understanding of the governing processes so that parameterizations, models and scenario systems can be constructed with greater performance and accuracy • Degree of understanding • “Sufficient” implies that at some point we have done enough research. • “Sufficient” is determined by model performance and the users.
Customers of air-sea exchange • Marine forecasting: shipping, aircraft operations • Offshore energy production: oil, wind, platform designs • Military and intelligence: EM/EO, SNR, CPE, bio-chem warfare, tomography, tactical reconnaissance, coastal tactical operations, strategic ops (incl. weather fcst) • Coastal zone and environmental management: red tides, oxygen depletion, fisheries, coastal erosion • Global and climate change, coupled model development, including mitigation, and satellite signature parameterization
Early observationalists - commerce, exploration, conquest* Navigation: Grooved Ware People, Phoenicia, Egypt, China...* Ancient weather lore: China, Greece, ...
Conceptualization of the effects of wind stress • 600 BC. Thales explores Egypt, Middle East, and Greek worlds. • Documents that north winds slow the forward flow of the Nile River, contributing to flooding.
Classifying observations and early teleconnections • Egyptians develop extensive shipping network, document climate differences. • Aristotle (384-322 BC). Meteorologica, incl the seas and climate • Central Africa rains linked to Nile flooding
Routine observations and simple forecasting • 300 BC, Athens. Wind vane used for routine observations • circa 200BC, Athens. Tower of Winds, built by Andronicus Cyrrhestes • 23-79 AD, Pliny the Elder. wind climatology of Mediterranean • Oceanography - Roman invasion of Britain.
Coastal to open ocean navigation • Vikings, Polynesians, early Peruvians transit over long distances, using observations of swell and the heavens, in 9th-14th centuries • 11th century Chinese invention of compass promotes open ocean exploration and trade (China, India, Arab world). • Compass reaches Europe 200 years later. • China extends trading network to east Africa (notably Madagascar) in 12th to 14th centuries • China/Japan contact American west coast. 12th-14th cent. • West Africans in contact with Americas (?) in 14th century
Era of data bases from 15th to 17th centuries • Race to control trade with Orient • Prince Henry’s Navigation School at Sagres. Closed in 1460 to protect politically sensitive marine and wind data. • Columbus in 1477-circa 1500 • Exploits and expands Portuguese data bases, with current, wind and wave height data from the North Atlantic. • Edmund Halley maps global currents and winds, 1686. • New technologies • 1430’s-1450’s. Windspeed (pressure plate) and hydrometry • 1620’s. Thermometry • 1750’s. First portable pressure plate anemometer.
Gas, aerosols, and fluid dynamics • 1650. Robert Boyle devises techniques to measure nitrogen, sulfur, and CO2 in air. Fluxes of these gases not measured until 1970! • 1690 circa. Isaac Newton states that for ordinary fluids, the stress is proportional to the shear, thus defining the viscosity coefficient. • =U/z • 1750. Maggraf hypothesizes that sea spray emissions are long transported. Meyrac confirms this in 1852. • 1782. Shallow water wave equations derived. Lagrange.
First controlled air-sea interaction experiment • In 1780’s. Benjamin Franklin introduces idea of wave roughness, during an experiment using oil applied to wind waves. • Discovered that roughness and waves are both damped by surface films. • He applied oil to real ocean waves, in an effort to test wave damping hypothesis. • Next known experiment of this type in 1970, in Buzzards Bay.
Exploiting the Gulf Stream • 1513. Ponce de Leon discovers the Gulf Stream • By early 1700’s, Gulf Stream is linked to whaling and fisheries • 1783. Franklin publishes first Gulf Stream charts for rapid mail delivery. • 1849. Gold Rush. New demand for navigation tools.
Matthew Maury • 1848. Produced Gulf Stream charts. • 1849. Calif. gold rush • 1849. Navigation industry expands to support CA. • 1851. Australia gold rush • 1853. First Maritime Meteorology Conference. Brussels • Dynamic meteorology starts. Ferrell (1858).
Early exploration of the oceans • Challenger: 1873-1875 • Global coverage, emphasizing phys. Oceanogr. • Meteor: 1925-1927 • Focus on the Atlantic • Currents and dynamics
1899 Stockholm Conference and ICES • After more than a decade of rising interest, King Oscar of Sweden convenes a conference on applications of oceanography to fisheries. • Subsequent creation of “International Council for Exploration of the Seas”, 1901. • ICES Christiania Laboratory (in Norway) employs V.V. Ekman, who in 1905 publishes theory to explain current shear as well as the flow of drift ice and icebergs.
Creation of fisheries and ocean geophysics laboratories (incl. ASE) • 1888 Plymouth Lab UK • 1892 Hopkins Marine Lab, Monterey • 1900 Institut für Meereskunde, Berlin • 1901 ICES Laboratory, Oslo • 1909 Scripps Institution of Oceanography, San Diego • 1917 Geophysics Institute, University of Bergen • 1919 Tidal Institute, Liverpool • many others starting in 1920’s. (WHOI in 1930).
Dawn of remote sensing and military applications • 1901. Marconi demonstrates transmission across Atlantic. • 1900-1905. Germans discover ships reflect radio waves. • 1930’s. Radar discovered, and applications race begins. • 1930’s. Discovery of sonar. • World War II. Sensors war. • National Labs and “big science” organized after WWII. • Manhattan project • Vannevar Bush report
Turbulence theories and early data underpinning air-sea exchange • 1896. Boussinesq. Concept of eddy viscosity coefficients. • 1909. First eddy diffusion and drag coefficients • Gehrke. Gulf of Finland data for eddy diffusion • Witting. Baltic Sea current profile data. • =CDU2, where CD= .0025 • 1915. Taylor. Eddy diffusion applied to the atmosphere • 1925. Prandtl. Mixing length theory. • 1930. Von Karman. Simplifying assumptions. • 1931. Rossby &Montgomery,Deuts Seewarte. CD= .0013
Why is the drag coefficient so important? • Wave height, H, scales with wind stress, thus H scales with CD for a given windspeed. • PBL depth scales with friction velocity, thus scales with square root of the drag coefficient, for given windspeed.. • Asymmetries of CD around storms, cause asymmetries of the vortex dynamics, since heat flux depends on CD. • Estimation of radar holes and duct heights depend on the surface stress and both sensible and latent heat flux. • Scatterometry, SAR, and sonar inversion algorithms (including clutter) are strongly linked to CD. • Climate models are very sensitive to CD.
How big is the drag coefficient? • Modelers want drag coefficient accurate to circa 20%, to predict wave state, winds, and surface roughness.. • storms growth and trajectories • environmental and climate assessments • TDA’s supporting military and intelligence • Rossby & Montgomery and Witting disagreed by a factor of two in the value of the drag coefficient. Problem attributed to “underwater” experimental designs. • In the early 1930’s, plans were underway to measure the drag coefficient using “over water” profiles.
ASE research moves above the surface • First over water profile and flux measurements • 1936. Montgomery publishes CD data, up to 6 m/sec. Buzz. Bay • 1940. Bruch (U,T) profiles to infer fluxes of momentum and heat. • 1948. Roll collects new data, up to 13 m/sec. Ship influences? • 1951. Francis. lake data. • 1953. Van Dorn. late data. • 1953. Sheppard and Omar. Over ocean. low winds. • 1954. Cox and Munk. Also included ocean ripple slope data. • 1955. Charnock. Laboratory data..
A theoretical paradigm emerges • Before 1950, data analyzed without a theoretical framework to describe all stratifications and regional differences. • Monin and Obukhov introduced concept that surface layer eddy spectra are scaled in reference to the surface (incl. surface fluxes) • Demonstrated that their new stability parameter, z/L, is nearly equivalent to Richardson number.
Monin-Obukhov similarity theory 1954 • Surface fluxes represent scaling parameters for boundary layer profiles, where stratification effects are included. • turbulent kinetic energy budget is nondimensionalized by surface fluxes. • Provides a physical basis behind different sampling methods, especially profile and eddy correlation, and applications to surface and boundary layers: • X/z=<w’x’>/u*kz x(z/L) • /=<-u’w’>=u*2=CD U2 • CD=[ k / ln(z/zo) - (z/L)]2
Other fluxes under MOS theory • Sensible heat flux and Stanton number • H/cp=<w’T’>=CH U (To-T) • CH=[k /ln(z/zo)-(z/L)][k/ln(z/zT)-T(z/L)] • Latent heat flux and Dalton number • E/Lv=<w’q’>=CE U (qo-q) • CE=[k /ln(z/zo)-(z/L)][k/ln(z/zq)-q(z/L)]
Validating and applying MOS theory • Technology limited until the mid 1960’s, when sonic anemometers were developed and deployable. • Immediate applications for EM/EO studies (AF, Navy). • Field campaigns over land confirmed predictions (Kansas, 1968; Minnesota, 1973; etc.) • Theory applied to air-sea interactions as early as 1964 • Over water field campaigns found systematic discrepancies in 1990’s (MBL project - FLIP & stationary platforms).
Politics affecting ASE: decade starting in mid 1950’s • Background in early/mid 1950’s • IGY to strengthen dialog between USSR and West • SCOR created to sustain oceanographic component (ICSU) • Sputnik launch in 1957. Collaboration sharply decreased, though SCOR sustained oceanography. • IOC created in 1961 under UN. Promote bilateral dialog • Indian Ocean Experiment (1964) backed by IOC.
Big Science of Air Sea Exchange • 1964. IIOE - Indian Ocean • 1968. BOMEX - Barbados • 1969. ATEX. Atlantic • 1974. GATE. Atlantic • 1975. AMTEX. Pacific • 1978. JASIN. North Sea, Atlantic • 1979. MARSEN. North Sea. Remote sensing • 1980. STREX. Pacific • 1985. HEXOS. North Sea • 1992. TOGA COARE. Tropical Pacific • 1992 SOWEX, Southern Oceans, Australia • 1992-93. SWADE/SWAPP. Atlantic, Pacific • 1995-96. MBL Project. Pacific, Scandinavia.
The “retrospective” review papers • 1962. Deacon and Webb (The Seas) • 103 CD = 1.00 +.07 U • 1977. John Garratt. • 103 CD = 0.75 +.67 U • 1981. Bill Large and Steve Pond • 103 CD = 0.44 +.063 U • 1990-2002. Numerous theoretical and practical reviews • e.g., Stu Smith, Gary Geernaert, Mark Donelan, Ian Jones, and Yoshiaki Toba.
Launched in 1978 Malfunctioned after 3 months Prompted a renewed interest in wave effects Scatterometry and drag coefficient Seasat - first ocean satellite
Reducing errors and uncertaintiesSimplifying assumptions • Physical • Neutral stratifications • Wave state in perfect equilibrium with stress • Spatially homogeneous • Outer layer induced fluxes correlate with inner layer induced fluxes • No flux divergence in surface layer • Stress vector and wind vectors aligned • Measurement techniques • Reynolds averaging is valid • Mechanical induced errors are unimportant • Dissipation in TKE perfectly balanced by production • Etc.
Parameterizing CD • CD expect lots of scatter • CDN stratification effects removed • CDNW strat and wave effects removed • CDNWH strat, wave, spatial heterogeneity • CDNWHO strat, wave, spatial het., outer layer
Going from CDNW to CDNWH • Apply steady state momentum equation • U U/x + <u’w’>/z = - -1p/x + fv • Combine with MOS law for weakly homogeneous conditions, i.e., using flux footprint concept • U/z = u*/kz (Øm - R - S + W + G) where • R= z/zozo/z • S= ß(z/L)2L/z • W= (kzU2/2u*3)U/x • G=kzfVgU/2u*3
Simplifications to the quasi-homogeneous parameterizations • U/z = u*/kz Øm + (U2/2u*2) U/x • CD*-1/2 = CD-1/2 + (z/2U)(U/x) CD*-3/2
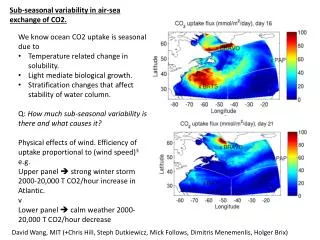
Drag coefficient simulations for the coastal zonewith constant 5 m/sec windspeed over domain
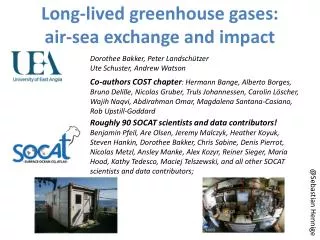
CH versus windspeed, from FPN and BIO (review by Oost, 1999)
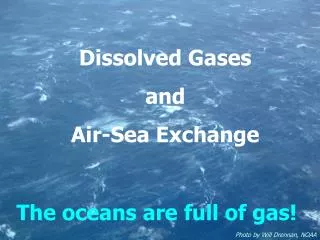
Does the heat flux coefficient, CH, depend on the drag coefficient? data from FPN (1985)
Does the heat flux coefficient, CH, depend on the drag coefficient? data from FPN (1985)
Needs to study circulation... x τ, not x V • Until the 1980’s, new measurements began to reveal that the stress and wind vectors are not necessarily aligned • Data from the North Sea: MARSEN, FPN • Data from FLIP during the early 1990’s • Laboratory data from NASA and IMST • Simple conceptual models started to appear in the 1990’s
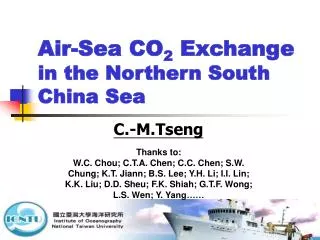
Wind stress vector and inertial oscillationsFPN 1985(Geernaert, 1988)
Direction of wind stress vector Candidate explanations for stress vector direction • aligned with velocity of breaking surface waves • aligned with wave slope vector, associated with wind waves and swell • aligned with combination of eddy fluxes in surface layer and outer layer … thermal wind driver • aligned with mean vector of U/z • aligned mean direction of U2 • Something else??
What do we know? • The stratification dependence reasonably well parameterized. Theory for stable flow is poor. • Wind stress and wave slope well correlated. Theory for wave-stress interaction weak when swell present • A simple theory for spatial inhomogeneity effects in place, but never tested with data • The outer layer influence addressed in LES, but inadequately evaluated with marine sfc layer data
A few PhD research ideas (1) • The role of swell on the wind wave spectra, in two dimensions • Swell influence on spectral energy flux • Swell influence on spectral momentum flux to the wave field, and in wave field