Pre-positioning Inventory for Emergency Response
420 likes | 540 Vues
This paper by Bahar Yetis Kara evaluates the effectiveness of pre-positioning inventory in emergency response efforts. Focusing on the practices of CARE International, one of the largest humanitarian organizations, it addresses the challenges faced during large-scale disasters. The analysis covers response times, cost efficiency, and optimal warehouse locations for emergency supplies. By examining existing supply chains and logistics, the study aims to improve the immediate provision of relief items to affected communities, ultimately enhancing the timeliness and effectiveness of humanitarian interventions.

Pre-positioning Inventory for Emergency Response
E N D
Presentation Transcript
Pre-positioning Inventory for Emergency Response By Bahar Yetis Kara Based on Duran, Guiterrez, Okwo, Keskinocak
CARE International Overview • (Cooperative for Assistance and Relief Everywhere, Inc.) • One of the world's largest private international humanitarian organizations - more than 12,000 staff • Founded in 1945 to provide relief to survivors of World War II • 22 American organizations worked together to provide “care packages” to the survivors of World War II
CARE International Overview • Mission: serve individuals and families in the poorest communities in the world • Strengthen capacity for self-help • Provide economic opportunity • Influence policy decisions at all levels • Address discrimination in all its forms • Deliver relief in emergencies • Operates in more than 65 countries
CARE Overview - Development • Hunger • Focus on young children • Education • YouTube - Imagine This- India␣ • Health • Training, nutrition, education, health services • HIV/AIDS – education, testing, treatment, caring for orphans • YouTube - Imagine This- Nepal
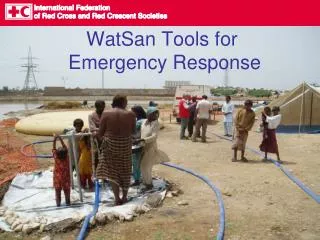
CARE Overview - Development • Economic development , empowerment of women • YouTube - The Girl Effect • Agriculture and natural resources • Water • Build and maintain clean water systems and latrines
CARE overview: Emergency Relief • Help communities create plans to deal with emergencies • Ensure communities receive food, water, shelter, healthcare and other emergency relief supplies when they need them most • Help communities recover and rebuild after disaster strikes • In 2001, CARE emergency projects directly assisted more than 7 million people in 26 countries
Responding to Floods in Nepal • Increase in flash floods due to soil erosion • Crops, livestock, homes, schools, roads, drinking water, standing pools • Response • 2.5 tons of food • Funds for medicine • Recovery and mitigation • Planting trees • Farming methods
Emergency response practice – historical perspective • Conduct most of the activities after the onset of the disaster • identify possible suppliers (local and/or international), • conduct the procurement process • identify potential warehouse sites • rent and set up warehouses • Most of the transportation is outsourced
Emergency response effectiveness • Response time • Coverage • Quality
Pre-positioning • CARE and most humanitarian organizations have relied historically on local suppliers. In fact, CARE has never pre-positioned • When there is a large scale disaster, local supplies run out and supplies have to be imported from unanticipated locations and transported by unanticipated systems • Pre-positioning can significantly reduce response time because it may eliminate the slow procurement process during the initial stages of the response
Local Suppliers Stimulate economy Low transportation cost Global Suppliers Higher availability Higher quality Pre-positioning Faster response Higher availability Low quality Lower availability Slower response Higher transportation cost Warehouse cost Inventory cost Direct Shipments vs Pre-positioning
Pre-positioning Inventory • Goal: Improve the efficiency & timeliness of emergency response • Evaluate effect of a pre-positioning strategy on response time and cost • How many warehouses to open and where? • Which items to pre-position, in what quantity, and where? • How to replenish warehouses? • Compare pre-positioning strategies • Response time • Cost • Warehouses • Purchasing & storage • Transportation costs
Analysis • Model Input • Relief items • Supply • Demand • MIP model • Given an initial investment, what is the configuration of the network that minimizes the average response time? • Results • Recommendations • Conclusion
Relief Items • Immediate needs of survivors • CARE’s specifications: • Food • Water& sanitation kit • Hot weather tent • Cold weather tent • Household kit • Hygiene kit
Supply • Existing suppliers • Direct shipment • Replenishment • 12 candidate warehouse locations Candidate Warehouse Locations
Candidate warehouse locations • United Nations Humanitarian Response Depot (UNHDR, www.unhrd.org) • is a Network to deliver humanitarian relief items worldwide within 24/48 hrs. • The Network provides storage, logistics support and services to • UN humanitarian agencies, • international humanitarian organizations, • governmental and non-governmental organizations, • thus reinforcing capacity for humanitarian emergency response.
Candidate warehouse locations Other locations identified by CARE Locations where CARE is considering to open a warehouse, possibly in collaboration with other humanitarian organizations
Demand – Affected People • Historical information • International disaster database • Natural disaster hotspots • Floods • Earthquakes • Windstorms • Tsunamis • Etc • 233 events in the last 10 years
Demand - Affected People • Historical information • International Disaster Database1 • Risk = Exposure * Vulnerability • Floods- Earthquakes- Windstorms- Waves- Droughts Natural Disaster Mortality Risk Hotspots2 1 – EM-DAT: The OFDA/CRED International Disaster Database, Universite Catholique de Louvain – Brussels – Belgium, URL http://www.em-dat.net2 – Natural Disaster Hotspots: A Global Risk Analysis, Center for Hazards and Risk Research at Columbia University, URL http://www.ldeo.columbia.edu/chrr/research/hotspots/
Demand for Relief items • Estimate the demand based on historical shipments of CARE • Historical data from the International Disaster Database (EM-DAT 2007) on the number of affected people affected by natural disasters over the last 10 years. • “affected” is defined as “ ...[a person] requiring basic survival needs such as food, water, shelter, sanitation . . . “ • Not just demand but base the demand to the number of affected people • Why?
Demand estimate • Why? • CARE does not have accurate records of past responses in terms of quantity and type of items supplied. • CARE usually collaborates with other organizations and only provides aid to portions of affected communities. • So even if CARE did have accurate records, we would have to consolidate data from numerous organizations. • Third, in the past responses relief items might be over or under supplied to assisted communities.
Demand Estimations • Collect data for the number of affected people by different disasters over the past 10 years • Estimate the actual demand quantities for different relief items using • the probability of need of different items • the number of items required by an affected person.
Demand Estimations • For the probability • Operational guidelines from the International Federation of Red Cross and Red Crescent Societies . • The guidelines, based on field experience, provide the likelihood of different needs of people affected by different disasters. • The likelihoods are expressed as “high” potential need, “medium” and “low”. • To determine the number of items required by a person: • CARE’s specifications.
Demand - Relief Items • probhil: likelihood that a person affected by disaster type h in demand location i will require iteml Potential Emergency Needs3 3 – Disaster Preparedness Training Manual. International Federation of the Red Cross and Red Crescent Societies. URL http://www.ifrc.org/WHAT/disasters/dp/manual.asp
Demand Locations • Demand points geographic location • Human Settlements Database4~ 55,000 settlements • Aggregation - 2 cases: • Country level (225 demand points) • Regional level (22 demand points) – UN sub regions Demand Locations – Regional Aggregation 4 – Center for International Earth Science Information Network (CIESIN), Columbia University; International Food Policy Research Institute (IFPRI), the World Bank; and Centro Internacional de Agricultura Tropical (CIAT), 2004. Global Rural-Urban Mapping Project (GRUMP), NY: CIESIN. Columbia University. URL http://sedac.ciesin.columbia.edu/gpw
Summary • 22 demand points (N) • 12 potential locations (M) • Flight distances (dij) • Disaster types (H) • 233 disaster instance (K) • Equal probability (pk) • 6 relief items (L) • H, L, M requirement
Summary • Expected demand for relief item l at location i at disaster instance k: (demikl) • dhik: number of affected people at regional demand location i by disaster type h in demand instance k. • phil: probability of supply l being required at regional demand location i by a person affected by disaster type h. • ahil : quantity of relief item l required by a person affected by disaster type h in demand location i
Mathematical Model • Notes
Large Model – Country Level 225 demand points 12 candidate warehouse locations 7 items 233 time periods 4,770,771 variables 386,633 constraints Small Model – Regional Level 22 demand points 12 candidate warehouse locations 7 items 233 time periods 466,562 variables 55,540 constraints Run Times
Results • Two types of budget: • the number of warehouses to open • the inventory amount to keep throughout the pre-positioning network. • Both of these constraints are always binding because the model assumes that demand can be satisfied faster from the pre-positioning warehouses than with direct shipments from the suppliers.
Results • Number of warehouses: 1-9 warehouses • 3 levels of inventory to store (Q) • high : 100% • medium : %50 • low: 25% of the average demand per instance
Results • Response time vs {number of warehouses, inventory level} • 3 levels of inventory
Results • Optimal warehouse locations
Optimal Locations and Inventory Allocation 3 Warehouses, Low Inventory Level
Optimal Locations and Inventory Allocation 3 Warehouses, Medium Inventory Level
Optimal Locations and Inventory Allocation 3 Warehouses, High Inventory Level
Optimal Locations and Inventory Allocation 4 Warehouses, Low Inventory Level
Recommendations • Based on the recommendations, • in collaboration with other humanitarian organizations, • CARE decided to establish 3 warehouses: • first pre-positioning facility in Dubai in 2008 • second and third one in Panama and Cambodia, respectively, in 2009.
Recommendations • CARE has pre-positioned more than one million sachets of water purification kits in each of the facilities. • Most recently, water purification tablets in Panama warehouse were used during the response to the 2010 Haiti Earthquake (Esterl and Mckay 2010).
References • Akkihal, Anup. “Inventory Pre-positioning for Humanitarian Operations.” Thesis MIT, 2006. • Barbarosoglu, G. and Arda, Y. (2004), “A Two-Stage Stochastic Programming Framework for Transportation Planning in Disaster Response.” Journal of the Operational Research Society55: 43 – 53. • Barbarosoglu, G., Ozdamar, L. and Cevik, A. (2002), “An interactive approach for hierarchical analysis of helicopter logistics in disaster relief operations.” European Journal of Operation Research140 (1): 118-133. • Beamon, Benita. “Distribution Network Design for Humanitarian Relief Chains.” Supply Chain and Logistics Seminar Series. Georgia Institute of Technology. Feb. 2006. • Beamon, B. M. and Kotleba, S. A. (2006a), “Inventory Modeling for Complex Emergencies in Humanitarian Relief Operations”, International Journal of Logistics: Research and Applications. • Beamon, B. M. and Kotleba, S. A. (2006b), Inventory management support systems for emergency humanitarian relief operations in South Sudan, The International Journal of Logistics Management. • Oh, Sei-Chang and Haghani, Ali (1996), “Formulation and Solution of a Multi-Commodity, Multi-Modal Network Flow Model for Disaster Relief Operations.” Transportation Research30 (3): 231-250. • Oh, Sei-Chang and Haghani, Ali (1997), “Testing and evaluation of a multi-commodity multi-modal network flow model for disaster relief management.” Journal of Advanced Transportation31 (3): 249-282. • Ozdamar L., Ekinci E. and Kucukyazici B. (2004), “Emergency Logistics Planning in Natural Disasters.” Annals of Operations Research129: 217-245.