Download
1 / 11
110 likes | 510 Vues
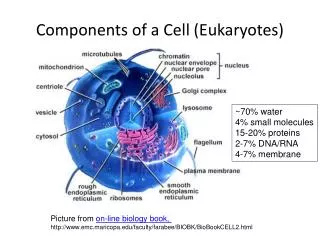
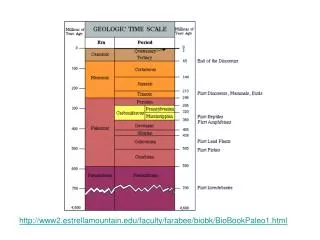
http://www2.estrellamountain.edu/faculty/farabee/biobk/BioBookPaleo1.html. www.geo.utexas.edu/courses/387H/Lectures/ GPC_ch8 .pp. http://www.globalchange.umich.edu/globalchange1/current/lectures/kling/paleoclimate/index.html. Ice core measurements.

E N D
http://www2.estrellamountain.edu/faculty/farabee/biobk/BioBookPaleo1.htmlhttp://www2.estrellamountain.edu/faculty/farabee/biobk/BioBookPaleo1.html
http://www.globalchange.umich.edu/globalchange1/current/lectures/kling/paleoclimate/index.htmlhttp://www.globalchange.umich.edu/globalchange1/current/lectures/kling/paleoclimate/index.html
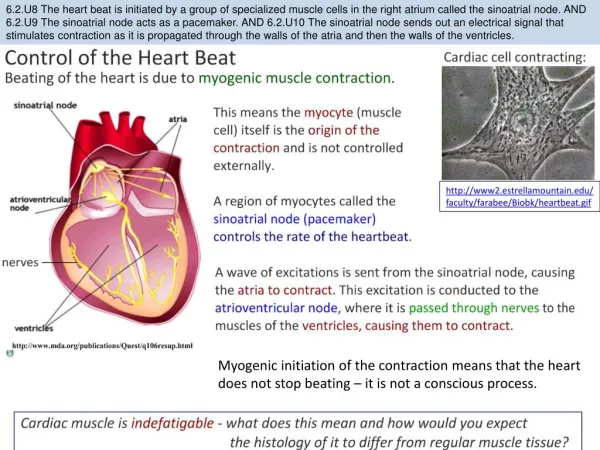
Ice core measurements Ice-core oxygenisotopic measurements from Greenland (right hand side) and from Antarctica (left hand side). The isotope measurements can be interpreted to yield the global sea surface temperatures to ~160,000 years ago (colder temperatures to the left). The two traces are consistent with each other and depict the most recent glacial period, ending ~15,000 years ago. http://www.globalchange.umich.edu/globalchange1/current/lectures/kling/paleoclimate/index.html
Snowball earth http://www.universetoday.com/wp-content/uploads/2007/03/2007-0323snowball.jpg
End of glacial deposits Figure 3. The geologists Paul Hoffman and Daniel Schrag, in Namibia, leaning on a layer of glacial sediments, among which is a large loose rock that fell to the bottom of the sea after being carried there by floating icebergs during the glacial phase. The strata is capped by a layer of carbonates sedimented after the glaciation (cap carbonates). http: //www-eps .harvard, edu/people/faculty/hoffman/sno wball_paper.html
http://en.wikipedia.org/wiki/File:Phanerozoic_Climate_Change.pnghttp://en.wikipedia.org/wiki/File:Phanerozoic_Climate_Change.png
Figure 5.13: The development of the global climate over the past 65 million years based on deep-sea oxygen-isotope measurements in the shell of benthic foraminifera (i.e. foraminifera living at the bottom of the ocean). Theδ18O temperature scale, on the right axis, is only valid for an ice-free ocean. It therefore applies only to the time preceding the onset of large-scale glaciation in Antarctica (about 35 million years ago, see inset in the upper left corner). Figure from Zachos et al. (2008).
Temperature changes are compared to the average surface temperature from 1951-1980