Data analysis: cross-tabulation
GAP Toolkit 5 Training in basic drug abuse data management and analysis. Data analysis: cross-tabulation. Training session 11. Objectives. To introduce cross-tabulation as a method of investigating the relationship between two categorical variables

Data analysis: cross-tabulation
E N D
Presentation Transcript
GAP Toolkit 5Training in basic drug abuse data management and analysis Data analysis: cross-tabulation Training session 11
Objectives • To introduce cross-tabulation as a method of investigating the relationship between two categorical variables • To describe the SPSS facilities for cross-tabulation • To discuss a range of simple statistics to describe the relationship between two categorical variables • To reinforce the range of SPSS skills learnt to date
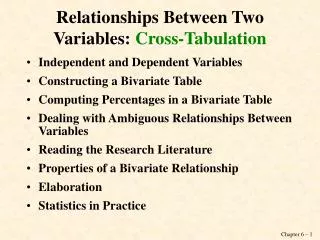
Bivariate analysis • The relationship between two variables • A two-way table: • Rows: categories of one variable • Columns: categories of the second variable
Out-of-range values (note that none of the digits are > 5) Mode of ingestion Drug 1
Cleaning Mode1 • Save a copy of the original • Recode the out-of-range values into a new value (for example,12, 15, 23, 24 ,25, 34, 234 into the value 8) • Set the new value as a user-defined missing value (for example, 8 is declared a missing value and given the label “Out-of-range”).
Mode of ingestion Drug1 * Gender cross-tabulation Count Row totals Grand total Joint frequencies Column totals Mode of ingestion Drug1
Percentages • The difference in sample size for men and women makes comparison of raw numbers difficult • Percentages facilitate comparison by standardizing the scale • There are three options for the denominator of the percentage: • Grand total • Row total • Column total
Marginal distribution Mode1 Joint distribution Mode1 & Gender Marginal distribution Gender Mode of ingestion Drug1 * Gender cross-tabulation Mode of ingestion Drug1
The distribution of Gender conditional on Mode1 Mode of ingestion Drug1 * Gender cross-tabulation Mode of ingestion Drug1
The distribution of Mode1 conditional on Gender Mode of ingestion Drug1 * Gender cross-tabulation Mode of ingestion Drug1
Choosing percentages • “Construct the proportions so that they sum to one within the categories of the explanatory variable.” Source: (C. Marsh, Exploring Data: An Introduction to Data Analysis for Social Scientists (Cambridge, Polity Press, 1988), p. 143.)
Dimensions Definitions of vertical and horizontal variables
Two-by-two tables • Tables with two rows and two columns • A range of simple descriptive statistics can be applied to two-by-two tables • It is possible to collapse larger tables to these dimensions
Relative risk • Divide the probabilities for “success”: • For example: P(Whitpipe=Yes|Gender=Male)=0.2318 P(Whitpipe=Yes|Gender=Female)=0.0701Relative risk is 0.2318/0.0701=3.309 • The proportion of males using white pipe was over three times greater than females
Odds • The odds of “success” are the ratio of the probability of “success” to the probability of “failure” • For example: - For males the odds of “success” are 0.2318/0.7682=0.302 - For females the odds of “success” are 0.0701/0.9299=0.075
Odds ratio • Divide the odds of success for males by the odds of success for females • For example: 0.302/0.075=4.005 • The odds of taking white pipe as a male are four times those for a female
Risk estimate Odds ratio M/F Relative risk of “success” Relative risk of “failure”
Exercise 1: cross-tabulations • Create and comment on the following cross-tabulations: • Age vs Gender • Race vs Gender • Education vs Gender • Primary drugs vs Mode of ingestion • Suggest other cross-tabulations that would be useful
Exercise 2: cross-tabulation • Construct a dichotomous variable for age: Up to 24 years and Above 24 years • Construct a dichotomous variable for the primary drug of use: Alcohol and Not Alcohol • Create a cross-tabulation of the two new variables and interpret • Generate Relative Risks and Odds Ratios and interpret
Cross-tabulations Joint frequencies Marginal frequencies Row/Column/Total percentages Relative risk Odds Odds ratios Summary