Download

1 / 13
150 likes | 298 Vues
From weather to climate. By the end of the lesson… ALL Level 6 Will create 2 living graphs for contrasting climates and compare these climates. SOME Level 7 Will progress to explain why the 2 places have such contrasting climates and suggest solutions to climate issues. L/O:

E N D
From weather to climate By the end of the lesson… • ALL Level 6 • Will create 2 living graphs for contrasting climates and compare these climates. • SOME Level 7 • Will progress to explainwhy the 2 places have such contrasting climates and suggest solutions to climate issues. L/O: To explain what climate is To apply this understanding to climate graphs Starter: In pairs play weather dominoes. Match the key word with the meaning... Which pair will win? Write down new words and research them later! Beth Harries, Central Foundation Boys' School, London.
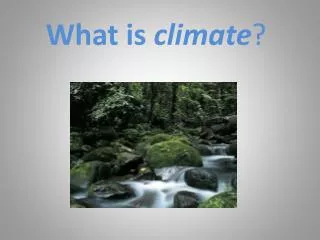
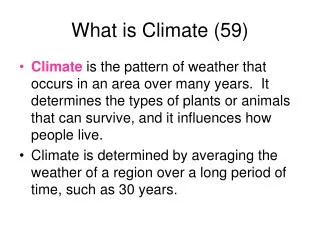
What is weather? What is climate? Recap of understanding... Without looking back in your books explain the difference between weather and climate. Weather is...whereas climate is... EXTENSION : London’s weather today is …In the future I predict it.... London’s climate is…In the future I predict it.... 5 mins max Beth Harries, Central Foundation Boys' School, London.
Look at the picture of London, it is lovely and sunny. The weather was good when the photo was taken. But a couple of hours later…it rained. Because weather can change from hour to hour and day to day. Unlike climate. Inser timage Beth Harries, Central Foundation Boys' School, London.
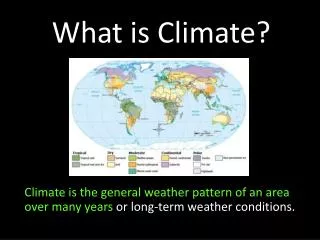
Climate is the average weather in a place. It tells you what the weather is usually like, in any given month. To do this, meteorologists take measurements everyday, over a long period of time (25-30 years). Then they calculate the average for each month. Beth Harries, Central Foundation Boys' School, London.
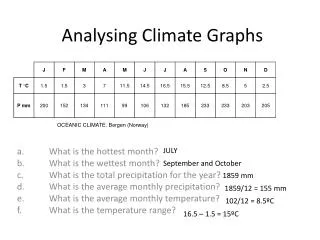
England’s Climate Graph • A climate graph shows a bar chart and line graph together • Think – pair – share • What does the bar chart show ? • What does the line graph show? • Which two months are usually hottest in London ? • Which month is usually driest ? Beth Harries, Central Foundation Boys' School, London.
Living Graphs Graphs do not just represent data and figures. They are helpful for real life too. You need to decide where the statements best fit on the graph. Simply put the number of the statement on the graph. You need to have a reason for your choice too! Beth Harries, Central Foundation Boys' School, London.
Look at the England Climate Graph. Simply put the number of the statement on the graph. You then need to have a list of reasons for each choice too! 12 minutes max Stu has to play hockey on the Astroturf not on the hockey field 2. Suzie decides that she should put on factor 25 sun cream on today. 3. Simon decides not to take his camera on the walk as it may get wet. 4. Sarah isn’t going to school today as the school is closed due to the snow. 5. Julie can’t go out on her bike as its too dark and wet after school. 6. Fred is late for work. He couldn’t drive through the ford – it was dangerous. 7. Paul puts his clothes out to dry on the washing line as it’s a warm day. 8. John decides he wants to sit on the beach all day sunbathing. 9. Alice decides to take her jacket out with her as it looks like it might rain. 10. James wants to go outside and fly his kite. 11. Felicity’s car won’t start today 12. Jane has to scratch the ice of her windscreen before she can drive to work.
Image of Mali countryside Beth Harries, Central Foundation Boys' School, London.
Image of Mali community Beth Harries, Central Foundation Boys' School, London.
Mali’s Climate Graph Insert Mali climate graph In the savanna regions of Mali, West Africa, the climate affects the lifestyle of the people. Most of the population depend on cultivation, fishing or farming. Imagine life here. How does the climate affect their lives and how is it different to ours in England? Reflect on the statements for the England climate graph. TASK: Now, create your own living graph statements for Mali in January, May and August. EG – In January in Mail, Ibrahim’s farm is… Ext: Explain another climate in the world we may have empathy for? Beth Harries, Central Foundation Boys' School, London.
L/O: To explain what climate is To apply this understanding to climate graphs By the end of the lesson… • ALL Level 6 • Will create 2 living graphs for contrasting climates and compare these climates. • SOME Level 7 • Will progress to explainwhy the 2 places have such contrasting climates and suggest solutions to climate issues. Beth Harries, Central Foundation Boys' School, London.
England’s Climate Graph Mali’s Climate Graph Insert Mali climate graph • TASK: Compare the climates of England and Mail. • Getting started... • Which is hotter/colder? • Which gets more rain? • What is the temperature/rainfall like in specific months? • How do these climates create issues for people? Always use temperature and rainfallfigures from the graphs Climate graph Rainfall (mm) Temperature (°C) England Mali Temperate Western Africa Month Ext Explain why the 2 places have such different climates. Are there solutions to the climate issues for people? Beth Harries, Central Foundation Boys' School, London.
Just a minute! Thinking about your thinking TASK: Reflect on today’s lesson Think about how you used a skill...Spend time reflecting… The lollipop may come to you! At the first repetition, pause or mistake another takes over and so on until the minute is up. Beth Harries, Central Foundation Boys' School, London.