Download
1 / 29
300 likes | 491 Vues
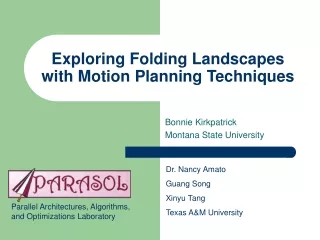
Using Motion Planning to Map Protein Folding Landscapes. Nancy M. Amato Parasol Lab,Texas A&M University. Paper Folding via Motion Planning. Polyhedron 25 dof (10 samples, 2 sec). Soccer Ball 31 dof (10 samples, 6 sec). Periscope 11 dof (450 samples, 6 sec). Box 12 (5) dof

E N D
Using Motion Planning to Map Protein Folding Landscapes Nancy M. Amato Parasol Lab,Texas A&M University
Paper Folding via Motion Planning Polyhedron 25 dof (10 samples, 2 sec) Soccer Ball 31 dof (10 samples, 6 sec) Periscope 11 dof (450 samples, 6 sec) Box 12 (5) dof (218 samples, 3 sec)
Protein Folding via Motion PlanningFolding Paths for Proteins G & L Protein L Protein G
Different from protein structure prediction • Predict native structure given amino acid sequence • Native 3D structure is important b/c influences function TTCCPSIVARSNFNVCRLPGTPEALCATYTGCIIIPGATCPGDYAN Protein Folding • We are interested in the folding process • how the protein folds to its native structure
prion protein normal - misfold Why Study Folding Pathways? • Importance of Studying Pathways • insight into protein interactions & function • may lead to better structure prediction algorithms • Diseases such as Alzheimer’s & Mad Cow related to misfolded proteins • Computational Techniques Critical • Hard to study experimentally (happens too fast) • Can study folding for thousands of already solved structures • Help guide/design future experiments
Configuration space Potential Folding Landscapes • Each conformation has a potential energy • Native state is global minimum • Set of all conformations forms landscape • Shape of landscape reflects folding behavior Native state Different proteins different landscapes different folding behaviors
Configuration space Potential A conformation Using Motion Planning to Map Folding Landscapes [RECOMB 01,02, 04; PSB 03] • Use Probabilistic Roadmap (PRM) method from motion planning to build roadmap • Roadmap approximates the folding landscape • Characterizes the main features of landscape • Can extract multiple folding pathways from roadmap • Compute population kinetics for roadmap Native state
Related Work • Other PRM-Based approaches for studying molecular motions • Other work on protein folding ([Apaydin et al, ICRA’01,RECOMB’02]) • Ligand binding ([Singh, Latombe, Brutlag, ISMB’99], [Bayazit, Song, Amato, ICRA’01]) • RNA Folding (Tang, Kirkpatrick, Thomas, Song, Amato [RECOMB 04])
Primary Structure TTCCPSIVARSNFNVCRLPGTPEALCATYTGCIIIPGATCPGDYAN Secondary Structure Tertiary Structure variable loops + + = • We model an amino acid with 2 torsional degrees of freedom: • Standard practice by biochemists sheet a helix Modeling Proteins One amino acid
Roadmap Construction: Node Generation • Sample using known native state • sample around it, gradually grow out • generate conformations by randomly selecting phi/psi angles • Criterion for accepting a node: • Compute potential energy E of each node and retain it with probability: Native state N Denser distribution around native state
Ramachandran Plots for Different Sampling Techniques Uniform sampling Gaussian sampling Iterative Gaussian sampling
Distributions for different types:Potential Energy vs. RMSD for roadmap nodes all alpha alpha + beta all beta
1. Find k closest nodes for each roadmap node (k=20) • use Euclidean distance 2. Assign edge weight to reflect energetic feasibility: u c1 c2 c3 cn v … lower weight more feasible 1 13 152 681 Roadmap ConstructionNode Connection Edge weight w(u,v) = f(E(C1), E(C2),… E(Cn)) Native state
PRMs for Protein Folding: Key Issues • Energy Functions • The degree to which the roadmap accurately reflects folding landscape depends on the quality of energy calculation. • We use our own coarse potential (fast) and well known all atom potential (slow) • Validation • In [ICRA’01, RECOMB ’01, JCB ’02], results validated with experimental results [Li & Woodward 1999].
One Folding Path of Protein AA nice movie…. But so what? B domain of staphylococcal protein A Ribbon Model Space-fill Model
Roadmap AnalysisSecondary Structure Formation Order [RECOMB’01, JCB’02, RECOMB’02, JCB’03, PSB’03] Order in which secondary structure forms during folding hairpin 1,2 helix Q: Which forms first?
10 time step at which each contact forms 30 20 40 50 native contact Formation Time Calculation • Secondary structure has formed when x% of the native contacts are present • native contact: less than 7 A between Ca atoms in native state If we pick x% as 60%, then at time step 30, three contacts present, structure considered formed
Contact Map A contact map is a triangular matrix which identifies all the native contacts among residues
135 142 (IV: 1-4) 1-2 1-4 140 143 114 140 143 140 141 142 144 139 143 143 131 3-4 Secondary Structure Formation Order:Timed Contact Map of a Path[JCB’02] residue # protein G (domain B1) residue # Formation order: , 3-4, 1-2, 1-4 Average T = 142
135 142 (IV: 1-4) 1-2 1-4 140 143 114 140 143 140 141 142 144 139 143 143 131 3-4 Secondary Structure Formation Order:Timed Contact Map of a Path[JCB’02] residue # protein G (domain B1) residue # Formation order: , 3-4, 1-2, 1-4 Average T = 142
Secondary Structure Formation Order:Validation Sample Summary
Detailed Study of Proteins G & L[PSB’03] Protein L Protein G Protein G • Protein G & Protein L • Similar structure (1 helix, 2 beta strands), but 15% sequence identity • Fold differently • Protein G: helix, beta 3-4, beta1-2, beta 1-4 [Kuszewski et al 1994, Orban et al. 1995] • Protein L: helix, beta 1-2, beta 3-4, beta 1-4 [Yi & Baker 1996, Yi et al 1997] • Can our approach detect the difference? Yes! • 75% Protein G paths & 80% Protein L paths have “right” order • Increases to 90% & 100%, resp., when use all atom potential
Helix and Beta StrandsCoarse Potential [PSB’03] • Protein G: • Protein L: (b3- b4 forms first) over 2k paths analyzed b2 b1 b4 b3 (b1- b2 forms first) over 2k paths b2 b1 b4 b3
Analyze First x% Contacts Contacts SS Formation Order 20 40 60 80 100 all a b1 b2 b3 b4 b1 b4 100 100 100 100 100 , - , - , - a b1 b2 b3 b4 b1 b4 99 99 99 99 , - , - , - 100 hydrophobic a b3 b4 b1 b2 b1 b4 1 0 1 1 1 , - , - , - Helix and Beta StrandsAll-atom Potential • Protein G: • Protein L: (b3- b4 forms first) Analyze First x% Contacts b2 Contacts SS Formation Order 20 40 60 80 100 b1 a b b4 b1 b2 b1 b4 79 79 74 82 90 , 3- , - , - all a b1 b2 b3 b4 b1 b4 21 21 26 18 10 , - , - , - b4 a b b4 b1 b2 b1 b4 77 74 71 77 81 , 3- , - , - hydrophobic a b b2 b3 b4 b1 b4 23 26 29 23 , 1- , - , - 19 b3 (b1- b2 forms first) b2 b1 b4 b3
Summary: PRM-Based Protein Folding • PRM roadmaps approximate energy landscapes • Efficiently produce multiple folding pathways • Secondary structure formation order (e.g. G and L) • better than trajectory-based simulation methods, such as Monte Carlo, molecular dynamics • Provide a good way to study folding kinetics • multiple folding kinetics in same landscape (roadmap) • natural way to study the statistical behavior of folding • more realistic than statistical models (e.g. Lattice models, Baker’s model PNAS’99, Munoz’s model, PNAS’99)
RNA Folding ResultsX. Tang, B. Kirkpatrick, S. Thomas, G. Song[RECOMB’04 ] • RNA energy landscape can be completely described by huge roadmaps. • Heuristics are used to approximate energy landscape using small roadmaps. • Our roadmaps contain many folding pathways. Energy profile Folding Steps • Population kinetics analysis on the roadmaps shows that heuristic 1 can efficiently describe the energy landscape using a small subset of nodes Map2 (Heuristic 1): 15 Nodes Map3 (Heuristic 2): 33 Nodes Map1 (Complete): 142 Nodes Population Population Population Folding Steps Folding Steps Folding Steps
Ligand Binding[IEEE ICRA`01] • Docking: Find a configuration of the ligand near the protein that satisfies geometric, electro-static and chemical constraints • PRM Approach(Singh, Latombe, Brutlag, 1999) • rapidly explores high dimensional space • We use OBPRM: better suited for generating conformations in binding site (near protein surface) • Haptic User interaction • haptics (sense of touch) helps user understand molecular interaction • User assists planner by suggesting promising regions, and planner will post-process and ‘improve’
Contact Information For more information, check out our website: http://parasol.tamu.edu/~amato/ Credits: My students: Guang Song (now a Postdoc at Iowa State), Shawna Thomas, Xinyu Tang & Ken Dill (UCSF) and Marty Scholtz (Texas A&M)