Download
1 / 134
1.34k likes | 1.46k Vues
This document outlines the grading framework for the 3rd term in Economics, detailing the weightage of assessments and participation. Key assessments include multiple choice and fill-in-the-blank questions, with study guides provided in advance. Extra credit opportunities are available for interested students, and there’s a focus on central banking and economic policies. Important dates include assessments in weeks 4 and 6, as well as instructions for studying materials. This outline is essential for students aiming for success in Economics.

E N D
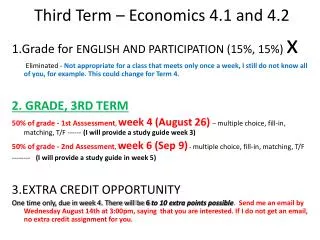
ThirdTerm – Economics 4.1 and 4.2 1.Grade for ENGLISH AND PARTICIPATION (15%, 15%) x Eliminated - Not appropriate for a class that meets only once a week, I still do not know all of you, for example. This could change for Term 4. 2. GRADE, 3RD TERM 50% of grade - 1st Asssessment, week 4 (August 26) – multiple choice, fill-in, matching, T/F ------ (I will provide a study guide week 3) 50% of grade - 2nd Assessment, week 6 (Sep 9) - multiple choice, fill-in, matching, T/F -------- (I will provide a study guide in week 5) 3.EXTRA CREDIT OPPORTUNITY One time only, due in week 4. There will be 6to 10 extra points possible. Send me an email by Wednesday August 14th at 3:00pm, saying that you are interested. If I do not get an email, no extra credit assignment for you.
Economics – 3rd Term 4. Video of the dog, why did we see that? 5. Hand-out on your desks, listen for the parts you are not responsible for, the rest you need to know for week 6 assessment 6. Today´s worksheet, work on it in pairs or groups the rest of class, it is not for an assessment but it is highly recomended to finish it at home and bring it to class next Monday
4.3 Economics – 3rd Term • FINAL CHANCE – ECONOMIC SUPPLY AND DEMAND MODEL, NEXT THURSDAY (week 2), 20 MARK ASSESSMENT • 16 MARKS FOR EXAM plus 4 marks for HW question
4.3 Economics • Final Exam for the Term (50%) – Monday of week 7 • Since we are not using English and Participation then the 2 assessments in weeks 2 and 4 will be 25% each of the grade
4.3 Economics – 3rd Term • WEEK 4 ASSESSMENT ON ALL OF THE MATERIAL WE COVERED AFTER THE ECONOMIC SUPPLY AND DEMAND MODEL • THE SLIDES WILL BE ON WIKISPACES AT THE END OF THIS WEEK • It will be necessary to study the slides on Wikispaces and ask the teacher about topics you do not understand
4.3 Economics - Week 4 Assessment • Multiple choice, fill-in, matching and True/False
4.1 and 4.2 • Today - Review of answerstohandout and continuingwithMacroeconomicslecture • Assessment – Week 4
Peruvian Central Bank What are thefunctions of the BCRP? The BCRP functions, as definedbytheConstitution, includethefollowing: -toregulatemoney and credit in thefinancialsystem - manageinternational reserves - issue notes and coins - periodicallyreportonthe country’ finances
Autonomy of a central bank WhatdoestheBCRP’sautonomyconsist of? In ordertofulfillitsmission, the BCRP mustenjoyautonomy (independent, notcontrolledbythegovernment)
More aboutthe BCRP (Peruvian Central Bank) • Whatisthemission of the BCRP? ---To preserve monetarystability. The Central Bank has establishedaninflation target of 2.0% BCRP actions are orientedtowardsmaintainingthislevel of inflation in thePeruvianeconomy.
Fromitswebsite…..Peruvian Central Bank Inflation is detrimental to economic development because it prevents money from adequately fulfilling its functions as a medium of exchange, as a unit of account, and as a store of value. Inflation discourages investment. The devaluation of money resulting from continuous rises in the prices of goods and services affects interest rates and thus both consumers and businesses Thus, by maintaining low inflation, the BCRP creates the necessary conditions for normal economic activity which, in turn, contributes to achieve higher levels of sustained economic growth.
Exports/Imports - Introduction • Exports are goodsthat are made (manufactured, produced) in a country, and soldto a companyorperson in another country • Example of a Peruvianexport: copper
Imports • Imports – a country buys a goodorservicefromanother country • Example: Kia (Korea) sells 10,000 Optima model cars to a Lima car dealer • Has anyoneeverseenallthe cars sitting in car lots in Callao, whenyouflyinto Lima?
Why do countriesexport and import? • No country in the world has all the natural resources, climate or geography to produce all the goods and food required by its population Many countries have more than enough of a specific resource or product and can export some of this "surplus" to other countries
Example - Canada • Many Canadians like to eat bananas, which can only be cultivated on tropical climates • Canada is close to the Arctic circle, no bananas can be grown on its soil and the easiest way to get them is to import them
Canada´sExports • But Canada has huge reserves of oil, which some countries do not have at all • As Canada has more than enough of oil to support its own needs, it can export some of its oil production to countries that require it and are willing to pay for it
Examples of Exporting/Importing - Japan • Japancosumes more than 5 millionbarrels of oil a day • Butitonly produces 138,000 barrels a day • So itmustimportalmost ALL of itsoilneeds
FromyourGeographytextbook • Example: Japan, itsexport and imports…..
Example - Russia • Produces 11 millionbarrels of oil a day (numberone in theworld) • Uses only 2.5 millionbarrels a day • So, itexportstheremaining 8.5 million (daily) • USA (bigproducer, butbigconsumeralso)
Cap`nCrunch • Whydoesn´tLaivestartproducingthis cereal toselltoPeruvianconsumers?
Top 20 Peruvian Exports 1 Copper Ores 2 RefinedCopper & Alloys 3 Gold 4 Zinc Ores 5 MeatFlourforAnimals 6 Non-CrudeOil 7 CrudeOil 8 Molybdenum Ores 9 Coffee 10 Silver
Top 20 Peruvian Exports 11 Lead Ores 12 Iron Ores & Concentrates 13 Knitted Sweaters 14 Fresh Vegetables 15 Tin 16 Zinc 17 CopperWire 18 KnittedMens & BoysShirts 19 Prepared Vegetables 20 FishFats & Oils
Top PeruImports - $41 billion in 2012 • Agriculture and othermachinery, certainchemicals, plastics, TVs, telecommunicationsequipment, iron, steel, wheat, soybeans, vaccines, cotton, paper • Cars ($2-3 billion)
Peru´s Major Trade Partners • No surprise……United States, China, Brazil, European Union and Chile
Exports add to the GDP of Perú • The Peruvian company exporting the good counts the exports as sales (all sales of all companies is the GDP of a country)
What effect does a change in your country´s currency have on your country´s exports? – Ifan American and wanttobuy a Peruviangood, thepersonorcompany has topayforthegood in Soles – So, the American has totakehis American dollars and buy Soles first -If Soles are more expensive (Sol up to 2.40 forexample = dollardown), thenthePeruviangoodscost more forthe American Ifthishappens… Peruvianexportstothe USA will decline
Example • I am buying a bottle of fishoilfor S./100 • Theexchangerateis 2.50 Soles to 1 US dollar • I need 40 US dollarstoobtain S./100 • Thenwiththe S./100 I nowhave I buythebottle of fishoil
Example • So, what if the dollar goes down (Nuevo Sol goes up), how does that affect the American company that is buying a bottle of fish oil from Perú? • We need to do a new calculation to find out how many dollars it takes to get S./100 because it is now different
New calculation • Supposetheexchangerateisnow 2.00 Soles foreach US dollar • So now I need 50 dollarstogetthe 100 soles instead of 40 dollars • AmericanswillbuylessfishoilfromPeru, thisisbadforthePeruvian GDP,buthaving a strong Sol isgood (forpurchasingpower, interestrates, etc..)…There are alwaystradeoffs
Peru in 2012 – Budget Surplus, Trade Surplus Budget Surplus - $2 billion– thisisgood Why? Simple, receipts are higherthanexpenditures Trade Surplus - $5 billion– thisisgood Why? Richminerals are in needaroundtheworld, Peruisbenefitting
USA - Budget Deficit, TradeDeficit • Budget Deficit $1.2 trillion Why? Taxestoolow, spendingtoomuch (governmentservices, defense, social security) • TradeDeficit $487 billion Why a deficit? Oilimports AND productsthat are beingproducedwithcheap labor are cheapertobuythantomakethem in the USA (high labor costs), likeforclothing and electronics
Otherstatistics, Perù • Top growingeconomy in all of LatinAmericathelast 12 years • Real GDP growthnowaround 5-6% • Yetinflationisonly in the 2-4% range • Unemploymentis in the 7% range
Bubbles We spoke of people getting too overconfident and overinvesting, causing a unsustainable growth with an ugly, ending, here is what the Japanese stock market did • http://finance.yahoo.com/echarts?s=%5En225+interactive#symbol=^n225;range=my;compare=;indicator=volume;charttype=area;crosshair=on;ohlcvalues=0;logscale=off;source=undefined;
1stbimester recap of the Definition of Economics • What is the Economic Problem? • We (you, me, the people of this school, Peru, the World) have unlimited wants and yet finite resources with which to achieve them. We cannot have everything we want. • This is called a scarcity (limit of) resources so we must decide what we will produce/consume
The Demand and Supply Curve Economic Model • Objectives: • Understand the demand curve • Understand the supply curve • What happens when supply and demand meet and what causes an increase or decrease in one or the other?
Can of Coke • How much are you willing to pay for an ice cold can of Coca Cola, that I will allow you to drink in class? • Let´s graph the result
Can of Coke • 100 soles? • 20 soles? • 12 soles? • 8 soles? 5 soles? 50 centimos? • Whatt do we have? Go to next slide
The Demand Curve • As the price increases (goes up) the quantity demanded decreases (goes down) = MOVEMENT ALONG THE CURVE • However, some things can actually move the curve, examples: • Changes in income (how much they people get paid) • Changes in consumer preference • Competitor prices
Movement (increase or decrease) of the demand curve Practice: • In which direction (right = increase or left = decrease) does the demand curve move in the following situations: • People get a pay rise (or in our example, your parents give you more money to bring to school) • A competitor decreases its prices
Movement (Increase or decrease) of the demand curve • You have a very successful advertisement on TV • The government increases income taxes • Ther product is found to be harmful to your health