Download
1 / 26
260 likes | 344 Vues
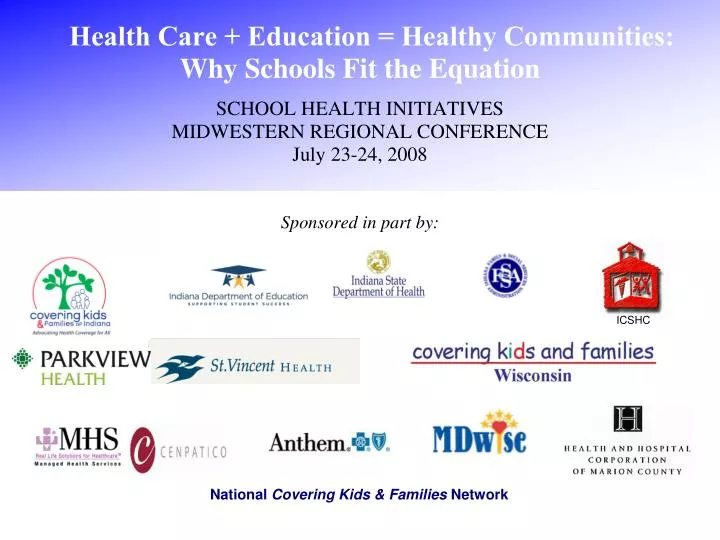
Healthcare + Education = Healthy Communities: Why Schools Fit the Equation. Kate Keller, MPA Senior Program Officer The Health Foundation of Greater Cincinnati. National Picture of SBHCs. Over 1700 SBHCs in 2005 87% located in the school building

E N D
Healthcare + Education = Healthy Communities: Why Schools Fit the Equation Kate Keller, MPA Senior Program Officer The Health Foundation of Greater Cincinnati
National Picture of SBHCs • Over 1700 SBHCs in 2005 • 87% located in the school building • 30% high schools; 80% serving at least one adolescent grade • 34% Hispanic; 30% Black; 30% White • 59% in urban areas • Midwest region: 275 SBHCs
Who we serve • 12 School-Based Health Centers • 31 Schools Served • 8,050 students enrolled (76% of student population) • 52% Medicaid; 16% uninsured • 16,791 encounters
What we learned Improved Health Status
What we learned Improved mental health status
What we learned Attendance success varied
SBHC Visit Outcome N=3707 N=5080 N=6354
Yearly Absences among Those Reporting ADHD across SBHC Users, Nonusers and Comparison Note: Statistical 3-way interaction
What we learned Improved access to healthcare
Percent of Parents Reporting Perceived Problems getting Health Care (N=581)
What we learned Medicaid costs did not increase
Trend of Total Medicaid Costs by SBHC per 100 Students for 22 quarters(N=2153) SBHC
What we learned Medicaid savings for a rural SBHC
Total Quarterly Medicaid Costs for Rural Schools per 100 Students (N=725) SBHC
What we learned Closed the gap of healthcare services for African-American students
Total Cost by Race 436.7 Other RACE = 0 black = 1 393.1 349.4 T 305.7 o t 262.0 a l 218.4 C 174.7 o s 131.0 t 87.3 43.7 0.0 -12.00 -7.80 -3.60 0.60 4.80 9.00 Quarter (Sept 1997 - Feb 2003) Growth Trend of Quarterly Total Costs by Race (N=5056) Racial Disparity: African Americans with low costs at the initial point, then, overcame the difference with SBHC.
What we learned Significant Medicaid savings for students with asthma
Numbers of Hospitalization and ER Visits for Children with Asthma in SBHC Schools (N=196) and Non-SBHC Schools (N=77) With SBHC, hospitalizations decreased 3-fold.
Hospitalization Costs Before and After SBHC for Students with Asthma (N=273) SBHC Hospitalization costs decreased $970 per student.
What we learned Increased use of mental health services
Medicaid Mental Health Service Costs before and after the SBHC Program for Students with Mental Health Problems (N=551) SBHC Students with mental health illnesses had more mental service costs.
For full study results see: http://www.healthfoundation.org/sbhcstudy.html Contact: Kate Keller kkeller@healthfoundation.org