Download
1 / 14
140 likes | 230 Vues
This study details diverse cloning and mutagenesis methods for GADD45a research, including primer sequences, mutagenesis procedures, and DNA replication analysis. The description also covers the application of site-directed mutagenesis and GFP analysis in the study of GADD45a.

E N D
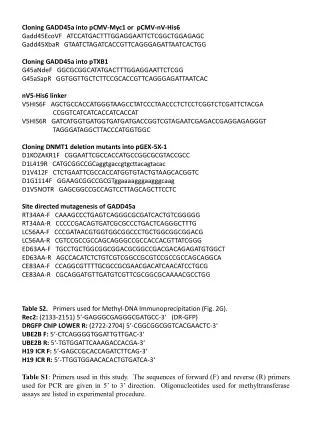
Cloning GADD45a into pCMV-Myc1 or pCMV-nV-His6 Gadd45EcoVF ATCCATGACTTTGGAGGAATTCTCGGCTGGAGAGC Gadd45XbaR GTAATCTAGATCACCGTTCAGGGAGATTAATCACTGG Cloning GADD45a into pTXB1 G45aNdeF GGCGCGGCATATGACTTTGGAGGAATTCTCGG G45aSapR GGTGGTTGCTCTTCCGCACCGTTCAGGGAGATTAATCAC nV5-His6 linker V5HIS6F AGCTGCCACCATGGGTAAGCCTATCCCTAACCCTCTCCTCGGTCTCGATTCTACGA CCGGTCATCATCACCATCACCAT V5HIS6R GATCATGGTGATGGTGATGATGACCGGTCGTAGAATCGAGACCGAGGAGAGGGT TAGGGATAGGCTTACCCATGGTGGC Cloning DNMT1 deletion mutants into pGEX-5X-1 D1KOZAKR1F CGGAATTCGCCACCATGCCGGCGCGTACCGCC D1L419R CATGCGGCCGCaggtgaccgtgcttacagtacac D1V412F CTCTGAATTCGCCACCATGGTGTACTGTAAGCACGGTC D1G1114F GGAAGCGGCCGCGTggaaaagggaagggcaag D1V5NOTR GAGCGGCCGCCAGTCCTTAGCAGCTTCCTC Site directed mutagenesis of GADD45a RT34AA-F CAAAGCCCTGAGTCAGGGCGCGATCACTGTCGGGGG RT34AA-R CCCCCGACAGTGATCGCGCCCTGACTCAGGGCTTTG LC56AA-F CCCGATAACGTGGTGGCGGCCCTGCTGGCGGCGGACG LC56AA-R CGTCCGCCGCCAGCAGGGCCGCCACCACGTTATCGGG ED63AA-F TGCCTGCTGGCGGCGGACGCGGCCGACGACAGAGATGTGGCT ED63AA-R AGCCACATCTCTGTCGTCGGCCGCGTCCGCCGCCAGCAGGCA CE83AA-F CCAGGCGTTTTGCGCCGCGAACGACATCAACATCCTGCG CE83AA-R CGCAGGATGTTGATGTCGTTCGCGGCGCAAAACGCCTGG Table S2. Primers used for Methyl-DNA Immunoprecipitation (Fig. 2G). Rec2: (2133-2151) 5‘-GAGGGCGAGGGCGATGCC-3‘ (DR-GFP) DRGFP ChIP LOWER R: (2722-2704) 5‘-CGGCGGCGGTCACGAACTC-3‘ UBE2B F: 5‘-CTCAGGGGTGGATTGTTGAC-3‘ UBE2B R: 5‘-TGTGGATTCAAAGACCACGA-3‘ H19 ICR F: 5‘-GAGCCGCACCAGATCTTCAG-3‘ H19 ICR R: 5‘-TTGGTGGAACACACTGTGATCA-3‘ Table S1: Primers used in this study. The sequences of forward (F) and reverse (R) primers used for PCR are given in 5’ to 3’ direction. Oligonucleotides used for methyltransferase assays are listed in experimental procedure.
GFP x A I-SceI BcgI Puromycin GFP HpaII GFP GFP 3‘common 5’-UnRec 3’ Transfection withI-SceI X 437 1 I-SceI 56 CCGG Rec BcgI DSB triggers HR Puromycin GFP GFP GFP Gene conversiton GFP Rec5’- GAGGGCGAGGGCGATGCC-3’ BcgI BcgI GFP GFP Primary HR Product Hemi-methylated DNA: GFP Puromycin GFP+ 5’-Rec 3’ common X B Figure S1. Map of the DR-GFP and Methylation Products. A. The DR-GFP Reporter System. The two cassettes are shown (GFP-I with the I-SceI site at stop codons) and GFP-II corresponding BcgI site that serves as donor DNA in the gene conversion process after I-SceI cleavage. Specific primer pairs allow unambiguous detection of HR structures as follows: Parental DR-GFP molecules are amplified by the 5’-UnRec primer and 3’ common primer (the latter does not exist in GFP-II) (Cuozzo et al., 2007). The 5’ REC primer (sequence shown) is indicated with the distinguishing bases in capital letters. An upstream promoter element (CMV enhancer and chicken actin promoter) provides high-level expression of the region. After HR and gene conversion, the proposed hemi-methylated intermediate is shown (primary HR-Product, Hem-methylated DNA). The filled in circles correspond to the location of the strand methylated segment (3’ of the new BcgI or converted I-SceI site, ca. 400 bp region). Subsequent events after DNA replication are depicted in Fig. S2. B. HpaII site in the repaired region between REC primer and 3’ common primer used for methylation sensitive restriction analysis Supplemental Figure S1 GFP
GFP HR Intermediate, Hemi-methylated DNA: BcgI BcgI Puromycin GFP+ 5’-Rec 3’ X DNA Replication Gives Two Expressor Populations FACS HR-L HR-H Figure S2. DNA replication results in expression classes based on DNA methylation. Following DNA replication, the primary HR-Product resolves into two populations that differ in methylation status. The low expressor class (HR-L) derives from templating off the methylated strand while the high expressor class (HR-H) derives from the unmethylated parental DNA, yielding hypermethylated and hypomethylated progeny cells, respectively, at the GFP locus. These populations are resolved as indicated in the hypothetical FACS profile (see Fig. 1B for actual FACS data). FL2H BcgI BcgI GFP+ GFP+ HR-H = Hypomethylated DNA HR-L = Hypermethylated DNA 5’-Rec 5’-Rec 3’ 3’ Supplemental Figure S2
polar MTLEEFSAGE QKTERMDKVG DALEEVLSKA LSQRTITVGV YEAAKLLNVD RT34AA hydrophobic charged(-) charged(-) PDNVVLCLLA ADEDDDRDVA LQIHFTLIQA FCCENDINIL RVSNPGRLAE LC56AA ED63AA CE83AA LLLLETDAGP AASEGAEQPP DLHCVLVTNP HSSQWKDPAL SQLICFCRES RYMDQWVPVI NLPER Alanine Scanning Mutagenesis of GADD45a Figure S3. Alanine Substitution Locations for mutations in GADD45a. Supplemental Figure S3
A 24 h 34 h B 46 h 5.0 % GFP+ 4.0 mRNA 3.0 3 % Total GFP+ 2 2.0 mRNA G45a\Actin 1.0 1 4 8 12 24 34 46 55 Hrs Post HR Figure S4. FACS data and time course of GFP. A. HeLa DRGFP cells were transfected with I-SceI and FACS analyses carried out at the times indicated. The regions designated M1 and M2 correspond to the HR-L and HR-H expressing populations, respectively. B. Kinetics of WT GFP Accumulation. HeLa DR-GFP cells were transfected with I-SceI and FACS analysis performed at the indicated times to determine the fraction of GFP expressing cells. The accumulation of stable G45a transcripts (relative to actin) are also shown. Supplemental Figure S4
A Myc-CE83AA + V5-CE83AA Myc-RT34AA + V5-RT34AA Myc-LC56AA + V5-LC56AA Myc-ED63AA + V5-ED63AA Myc-G45a + V5-G45a V5-RT34AA V5-LC56AA V5-ED63AA V5-CE83AA V5-G45a IP : a-Myc WB: a-V5 IP : a-Myc WB: a-Myc Figure S5. Analysis of Dimerization Potential for G45a Mutations. A. Dimerization analysis. HeLa cells were transfected with the indicated Myc or V5 plasmids (3 ug each). Immunoprecipitations were carried with anti-Myc antibody and probed with V5. Co-IP self-association levels (lanes with one protein only) were subtracted in the digitized data analysis (four independent experiments). The digitized data are shown in Fig 5A. For each mutant, recoveries by Co-IP were normalized relative to overall expression levels for each mutant by Western blot analysis using actin as the loading control. Expression levels between mutants varied by as much as 2 fold. B. Influence of ectopic G45a on GFP expression. HeLa DR-GFP cells (a single clone) was transfected with the indicated expression plasmids (I-Sce plus or minus 0.5 ug of wild type G45a or the CE83AA mutant; all plasmids express constitutive levels using the CMV enhancer). Total GFP expression levels were measured 48 hr after transfection (three experimental repeats). B 7 + GADD45a Myc GADD45a V-5 6 5 4 % Total GFP 3 2 1 WT G45a No G45a CE83AA G45a + I-SceI Supplemental Figure S5
A MW GADD45a 1600 nM 800 nM 400 nM GADD45a 200 nM 100 nM 70 MW Crude Purified 55 180 B DNMT1 40 1600 nM 115 35 800 nM 82 64 25 400 nM 800 nM 200 nM 100 nM DNMT1 Response 15 400 nM 200 nM 100 nM Time Supplemental Figure S6AB
C 1600 nM 800 nM 400 nM 200 nM 100 nM D 1600 nM 800 nM 400 nM 200 nM 100 nM Supplemental Figure S6CD
Figure S6. SPR Analysis. DNA/protein binding affinities were calculated using Surface Resonance Plasmon (SPR) assays. Panel A. Biotinylated unmethylated duplex oligonucleotide DNA was immobilized on the gold chip coated with NeutrAvidin as described in “Materials and Methods”. Purified GADD45a (inset gel shows purity of GADD45a) was applied to the chip at a concentration of 100, 200, 400, 800 and 1600 nM (flow rate of 13.3 µl/min). The KD value is (inset table) derived from kinetic parameters based on the relationship KD = kd/ka where kd is the dissociation rate constant and ka the association rate constant. The ka and kd rate constants were derived by non-linear curve fitting of sensogram data at the concentrations indicated above. A representative SPR trace is presented that was fit to model data (smoothed red line). Panel B is identical to A except a hemimethylated DNA target was tested (30-mer duplex DNA with a single Me-CpG centrally located; see “Materials and Methods”). The inset data shows a control experiment with DNMT1 (purity of protein is shown along with the sensogram and KD value). Panel C. Analysis of GADD45a binding to fully methylated DNA bound to gold chip. Panel D. Reverse Binding SPR Control: Analysis of hemimethylated DNA binding to gold chip linked GADD45a. Purified, biotinylated GADD45a was bound to the gold chip and hemimethylated DNA was at the concentrations indicated was bound and quantified to derive the indicated KD value. The analysis was repeated using unmethylated and hemimethylated DNA; however, binding was sufficiently weak as to preclude accurate KD determination. Curve fitting was based on four experimental determinations. Supplemental Figure S6
#49 #50 #49 #50 A con con G45a 212 bp Actin 250 bp 100 80 60 Relative Induction % 40 20 E #49 #49 #50 Con #49 #50 B Con Con 35 cycles 36 cycles 37 cycles #50 C 100 120 Con 80 100 60 80 Relative GFP Expression % Low GFP Expressors % Cycles 40 60 40 20 20 #50 #49 Con #50 #49 Con D Control #49 #50 - + - + - + 16% 39% 4% Supplemental data Fig. S7
Figure S7. Analysis of shRNA G45a knock down cells in three independent shRNAs A. A clonal isolate of HeLa cells, HO1 cells, was selected containing a single integrated copy of the DR-GFP reporter. This isolate converts to GFP+ cells following I-SceI transfection generating two populations of expression classes (low and high) that differ in methylation frequency over the repaired segment. These cells were used in G45a knockdown experiments. The shRNAs used are described in the “Materials and Methods” and represent two different regions, indicated as #49,50, along with a scrambled shRNA control (“con”). Expression of G45a following transient transfection with each construct was determined by RT-PCR along with an actin control. The graphical data correspond to relative G45a mRNA levels based on G45a/actin ratios in UV treated (open boxes) or non-UV treated (shaded) cells. RT-PCR analyses were performed at 48 hr after transfection; however, identical results were seen at 72 hr post transfection (not shown). B. Analysis of HR frequency in shRNA knock down and control cells. Transfected cells were analyzed by Q-PCR using the 5’ REC primer specifically amplifies HR products (graphical data for #49,50 shown in panel E). C. Analysis of GFP expression. HeLa DR-GFP cells were co-transfected with I-SceI plus indicated shRNA expressing plasmid and 48 hr later, cells subjected to FACS to determine total GFP expression (left) or HR-L low expressing population. D. Methylation sensitive restriction enzyme analysis. Cells were transfected with indicated shRNAs or scrambled RNA control and after 48 hr, recovered genomic DNA was subject to HpaII digestion (+) or no digestion (-) followed by PCR amplification using the 5’ REC primers to assess the overall percentage of HpaII sensitivity (see Fig. S1B for map). The values given below each lane correspond to the digestion residuals. Thus, in control cells 4% of the total resisted digestion and were therefore methylated at the HpaII site. E. Graphical data of recombination frequencies for two representative shRNA clones #49,50 (based on Panel B).
Figure 1B, 1C Statistical Analysis of HR-H (High Expressor) and HR-L (Low Expressor) Classes of GFP Figure 1F. Oneway Analysis of EzH2 siRNA mRNA levels Figure 1F. Oneway of G45a siRNA mRNA levels Supplemental data Fig. S8
Figure 1D Statistical Analysis of percent of recombination at 5days and 7days after I-SceI transfection Figure 1F Statistical Summary of Methyl DIP Supplemental data Fig. S9
Figure 2C Statistical Summary Figure 2A Statistical Summary Supplemental data Fig. S10