Download
1 / 34
340 likes | 619 Vues
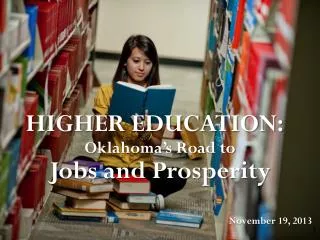
HIGHER EDUCATION:. Oklahoma’s Road to. Jobs and Prosperity. November 19, 2013. 2014 State Regents’ Legislative Agenda and Budget Request. Complete College America Prohibit Weapons on Campus Oklahoma’s Promise. Campus Security.

E N D
HIGHER EDUCATION: Oklahoma’s Road to Jobs and Prosperity November 19, 2013
2014 State Regents’ Legislative Agenda and Budget Request • Complete College America • Prohibit Weapons on Campus • Oklahoma’s Promise
Campus Security • The State Regents, all 25 institutions, and all governing boards believe that there is no scenario where allowing guns on our campuses will do anything other than create a more dangerous environment for our students, our faculty, our staff and our visitors. • In past six legislative sessions, legislation has been introduced or discussed that would allow students to carry weapons onto college campus. We have successfully stopped the legislation to date. • It will continue to be a top priority of our higher education system to ensure that this legislation does not become law.
Number of Oklahoma’s Promise Scholarship Recipients Assumes 1% annual increases in OK Promise high school enrollment and 65% completion rate of high school requirements for scholarship eligibility. 20,081 20,029 19,650 19,426 19,300 19,000 18,298 16,929 17,000 15,000 14,669 13,000 12,101 11,000 9,155 9,000 7,000 5,889 5,000 2,982 3,000 2,004 1,717 1,000 2012-13 2011-12 2013-14 2009-10 2004-05 2005-06 2001-02 2003-04 2010-11 2000-01 2002-03 2006-07 2007-08 2008-09
In The Global Economy of the 21st Century, 90 Percent of the Fastest-Growing Jobs Will Require a Higher Education. Source: United States Bureau of Labor Statistics 2
Nationally, more than one-quarter (29.1 percent) of adults 25 and older have a bachelor’s degree or more. compared to Oklahoma at 23.8 percent. Source: Bureau of the Census 2012
State Per Capita Personal Income v. Share of Adult Population with Bachelor's Degree or Higher The Overwhelming Majority of States That Have a High Percentage of Their Citizens with a College Degree Have a Higher Per Capita Income. California Colorado Connecticut Delaware Illinois Maryland Massachusetts Minnesota New Hampshire New Jersey New York Rhode Island Vermont Virginia Washington Wyoming No state with a low percentage of its citizens with a college degree has a highper capita income. Alabama ArizonaArkansas Florida GeorgiaIdaho Indiana IowaKansas Kentucky LouisianaMaine Michigan MississippiMissouri Montana NebraskaNevada New Mexico North Carolina Ohio Oklahoma OregonSouth Carolina South Dakota TennesseeTexas Utah VermontVirginia West Virginia Wisconsin Source: United States Bureau of Economic Analysis
Learn More, Earn More 2012 Median U.S. Earnings by Educational Attainment(for workers age 25 and older) Source: Bureau of Labor Statistics, Current Population Survey 2012
$5,254,193Professional $3,982,577Doctorate $2,963,076Master’s Degree $2,567,174Bachelor’s Degree $1,801,373Associates Degree $1.1 M more in a Lifetime than HS Grad $1,725,822Some College $1,455,253High School Graduate Lifetime Earnings! Source: U.S. Department of Commerce Economics and Statistics Administration – U.S. Census Bureau
No High School Diploma 12.4% High School Diploma 8.3% Some College 7.7% Associates Degree 6.2% Bachelor’s Degree 4.5% Master’s Degree 3.5% Doctoral Degree 2.5% Professional Degree 2.1% Source: Bureau of Labor Statistics, Current Population Survey 2012
Students Who Learn Here, Earn Here Percent of Oklahoma Residents Who Graduate with a Bachelor’s Degree Remain In the State and are Employed In the State One Year After Graduation 87%Remain in the State Source: 2012 Employment Outcomes Report
Link Academic Programs to the needs of Business • Healthcare, Allied Health and Nursing • Engineering • Business • Aviation and Aerospace • Wind Turbine Technology • Health Information Management • Management Information Systems
Higher Education Cost Savings A total cumulative cost savings of $451.7 million from 2011-15. $500 m $451.7 m $450 m $411 m • Changes in Salaries and Benefits • Changes and Elimination of • Positions • Energy Conservation and • Conversion • Reduction in Supplies • IT Savings $400 m $350 m $347 m $300 m $250 m FY14 Cost Savings $43.6 $200 m $150 m $112 m $100 m $74 m $50 m $0m 2011 2012 2015 2014 2013 Source: FY15 Institutional Budget Needs Survey
Higher Education Cost Savings $75 m $73.5 m $70.9 m $60 m $49.3m $45 m $30 m $16.3 m $15 m $2.1 m $1 m Travel, Periodicals and Other Transfers and Other Utilities Supplies Personnel and Benefits 15 Source: Oklahoma State Regents for Higher Education
Information Technology Cost Savings 2011 - 2015 $239.7 Million FY14 $48.2 Million
Oklahoma’s 25 College and Universities have an active and productive grantsmanship program which contributes to the institutions funding outside the appropriations process. • In FY14, our institutions reported $620.3 million in competitive grants for program development and research. Source: Oklahoma State Regents for Higher Education
System Overview $1,050.9 billion $1,039 billion $1,001 billion $988.5 million $955 million $945 million $943.7 million FY09 FY13 FY08 FY14 FY10 FY12 FY11 History of State Appropriations
Higher Education’s Percent of Oklahoma Total State Appropriations 20% 18.6% 15.8% 15.6% 15.3% 15% 14.8% 14.6% 10% 5% FY13 FY00 FY90 FY10 FY80 FY14
State Appropriations as a percent of Total Higher Education Budget 100% 80% 74.2% 60% 50.8% 39.9% 40% 39.5% 38.7% 20% 0% 2014 1988 2012 2013 2007
Record Enrollment 186,067 177,385 Academic Year 2013 Academic Year 2008
Tuition and Mandatory Fees Tuition and Mandatory Fee Increases in 2009 – 2013 5.8% 5.2% 5% 4.7% 0% 2010 2011 2012 2013 2009
Arizona 78% California 72% Florida 67% 5 – year Change in Public Four Year College Tuition and Fees Washington 64% Georgia 63% Source: College Board: Average Published Tuition and Fees by State 2004-05 through 2012-13
ENTERPRISING STATES • Nationally, Oklahoma is Ranked: • 8th in Higher Education Efficiency • 7th in College Affordability • 19th in STEM Job Growth Source: “Enterprising States” – A Project of the US Chamber of Commerce and the National Chamber Foundation
Student Debt Report “According to the report, Oklahoma places 8th in Nation on the list of States with the lowest student debt.” The Project on Student Success – Institute for College Access and Success Oklahoma is 21% below the national average in student debt.
COMPLETE COLLEGEA M E R I C A “Over the Last Two Decades, the United States has declined in Degree Completion From 1st in the World to 16th in the World” Organization for Economic Cooperation and Development Korea United Kingdom Ireland New Zealand Japan Norway Australia Denmark Luxembourg Canada Russia Sweden Belgium USA France Israel
Transform Remediation Focus On College Readiness Strengthen Pathways to College Degrees and Certificates Increase Adult Degree Completion Reward Performance COMPLETE COLLEGEAMERICAThe Oklahoma Plan
COMPLETE COLLEGEAMERICA 50,900 2,945 Goal 1,700 30,500 2023 2012 2011
GOOD NEWS
H I G H E R E D U C A T I O N R E P O R T Oklahoma Public Higher Education: Economic and Social Impacts RESEARCH FOUNDATION
Battelle Findings on the Economic Impact of Oklahoma Higher Education H I G H E R E D U C A T I O N R E P O R T • Public higher education has an impact of $9.22 billion on the state’s economy annually and supports more than 85,000 Oklahoma jobs; • The estimated return on investment for public higher education is $4.72 for every $1.00 of state funding; • Public universities have a strong and flourishing presence in advanced research, conducting $360 million in annual research and growing their research volume at a pace that exceeds the national growth rate. • For every $1 in state funding, public universities attract an additional $2.24 in federal funding.
FallinForBusiness.com Perceptions of Oklahoma’s Business Climate “The Quality of our two/four year college and university system” #1 Business Climate Strength in the State
FallinForBusiness.com Perceptions of Oklahoma’s Business Climate Highest Ranked Business Climate Factors Affordable housing options for employees Recreational opportunities Access to supplies required to conduct business Career-Tech System Preparation for the workplace Quality of 2/4 year College/University system
HIGHER EDUCATION: Oklahoma’s Road to Jobs and Prosperity