Download
1 / 20
210 likes | 349 Vues
9. Perfect Competition and the Supply Curve. Perfectly competitive market. many firms standardized product firms freely enter or leave the market each firm is a price taker. Total Cost. Marg Rev. Q. Total Rev. Marg Cost. Price. Profit. 6. 78. 25. 72. 150. 25. 175. 7. 91.

E N D
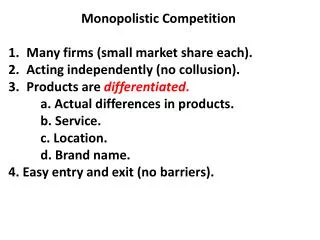
9 Perfect Competition and the Supply Curve Perfectly competitive market • many firms • standardized product • firms freely enter or leave the market • each firm is a price taker
Total Cost Marg Rev Q Total Rev Marg Cost Price Profit 6 78 25 72 150 25 175 7 91 84 99 25 101 8 200 99 9 126 225 25 84 250 25 10 166 Production and Profits Perfect competition: price unaffected by quantity
220 200 99 180 160 99 140 120 Cost or Revenue ($) 100 80 60 40 20 2 4 6 8 10 Output Total revenue Maximize Total Profit Note: Maximum profit where slopes of the two curves are equal. Total cost
40 35 30 25 20 15 10 Cost or revenue ($) 5 2 4 6 8 10 Output Marginal Rev = Marginal Cost Marginal cost Marginal revenue Note: Maximum profit where MR=MC.
200 180 160 140 120 Cost or Revenue ($) 100 80 60 40 20 2 4 6 8 10 Output The Shut-Down Decision Total cost Net loss at every level of output. But if fixed costs are unavoidable, ignore them in the shut-down decision. Variable cost Total revenue Maximize revenue over variable cost
40 35 30 25 20 15 10 Marginal revenue Cost or revenue ($) 5 2 4 6 8 10 Output Marginal Rev = Marginal Cost Marginal cost If price (MR) is constant, MC curve shows how much output will be supplied. Marginal revenue
40 35 30 25 20 15 10 Cost ($) 5 2 4 6 8 10 Output The Short-Run Supply Curve Marginal cost Short-run Supply Price ($) Average variable cost No supply when price < $5
40 35 30 25 20 15 10 Cost or Price ($) 5 $9 4 units 2 4 6 8 10 Output Short-Run Profit or Loss Short-run Supply Average short-run total cost Long-run: firms will exit the market $36 loss Price = Average Cost = Quantity =
40 35 30 25 20 15 10 Cost or Price ($) 5 $11 9 units 2 4 6 8 10 Output Short-Run Profit or Loss Short-run Supply Average short-run total cost $99 profit Long-run: firms will enter the market Price = Average Cost = Quantity =
40 35 30 25 20 15 10 Cost or Price ($) 5 2 4 6 8 10 Output Long-Run Equilibrium: Price = Minimum Cost Short-run Supply Average short-run total cost Price = Average Cost = Quantity =
40 35 30 25 20 15 Price ($) 10 5 200 400 600 800 1000 Output Supply & Demand for Entire Market Short-run Supply Market Demand Price = $12 Quantity = 100 x 7 = 700
40 35 30 25 20 15 Price ($) 10 5 200 400 600 800 1000 Output Shift in Demand: Constant Cost Industry • Increase in demand • each firm increases output • temporary profits
40 35 30 25 20 15 Price ($) 10 5 200 400 600 800 1000 Output Shift in Demand: Constant Cost Industry • New firms enter • short-run supply shifts • profits back to $0 Price = $12 Quantity = 135 x 7 = 945
40 35 30 25 20 15 Price ($) 10 5 200 400 600 800 1000 Output Constant Cost Industry • firms enter or exit until price returns to minimum cost Market Demand Long-run Supply
40 35 30 25 20 15 Cost ($) 10 5 2 4 6 8 10 Output Increasing Cost Industry • average costs increase as more firms enter Average short-run cost: 200 firms Average short-run cost: 100 firms
40 35 30 25 20 15 Price ($) 10 5 200 400 600 800 1000 Output Increasing-Cost Industry • long-run supply curve slopes upward Market Demand Long-run Supply
Price = $25 Profit = $0 Firms 1, 2 … 45 # units = ____ total # units = ____ Firms 1, 2 … 100 # units = ____ total # units = ____ Profit = Shift in Supply Firms 46 … 100 enter the market Higher Quantity, Price = $
Profit = $0 Profit = $0 Shift in demand Firms 1, 2 … 135 # units = ____ total # units = ____ Price = $ Firms 1, 2 … 100 # units = ____ total # units = ____ Price = Shift in Supply Firms 101 … 135 enter the market Profit =
40 35 30 25 20 15 Price ($) 10 5 200 400 600 800 1000 Output Surplus: Increasing-Cost Industry Market Demand Long-run Supply
40 35 30 25 20 15 Price ($) 10 5 200 400 600 800 1000 Output Surplus: Constant-Cost Industry Market Demand Long-run Supply