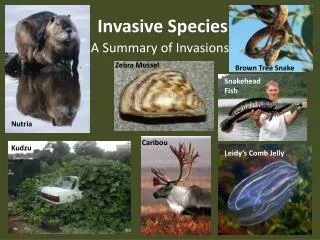
Decrease in Biodiversity due to Invasive Species
Explore the decrease in biodiversity caused by invasive species on campus. Lab data and analysis reveal the impact of Japanese and Amur Honeysuckle. Literature review, methods, and results are discussed.

Decrease in Biodiversity due to Invasive Species
E N D
Presentation Transcript
Decrease in Biodiversity due to Invasive Species Bao Duong Emily Rogers University of Cincinnati Clermont College, Batavia, Ohio, USA. Professor Janet Carter Ecology Bio. 303 May 25th, 2012
Acknowledgments We would like to give thanks to our Ecology Professor at UC Clermont, Janet L. S. Carter, for teaching us all about ecology and letting us use her web pages. Thank you.
Abstract Duong, Bao. Rogers, Emily. 25 May 2012. Decrease in Biodiversity due to Invasive Species. Lab data that was collected in the spring ecology class at UC Clermont was used to analyze the decrease in biodiversity due to invasive species on campus. Flora sampling, environmental factors, soil analysis and water analysis was all done to compare campus factors and diversity. Relative density was done to compare the numbers of honeysuckle present on campus, which was found to decrease the biodiversity due to the invasive species.
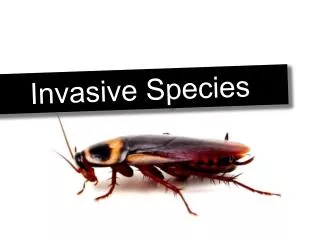
I: Introduction Invasive Species have played a role to the native environments around the world. Invasive species have been shown to have the potential to cause harm to the native wildlife by competition of resources, which can decrease biodiversity. • The purpose of this experiment was to evaluate the invasive species: Japanese, and Amur Honeysuckle and their impact to biodiversity on campus at UC Clermont.
I: Introduction continued • Research on the invasive species on campus should be noticed and cared about, because it deals with the future diversity of wildlife on campus. • This research should be done to keep a running track of year to year basis and data for future references. The information gathered will lead to show the growth or dis-growth of the invasive species. • The effects of the invasive species to its ecosystem on campus is interesting and useful information that is gained by this research.
II: Literature Review • In the past, experiments have shown the effects of invasive species to genetic diversity within a population of a species. • Major threats of invasive species includes: • predation, • decreasing biodiversity, • altering ecological conditions and • competition for resources (National Wildlife Federation)
II: Literature Review • Calsbeek (2010) examined the genetic impact on Brown Anole Lizard (Anolissagrei),due to predation of an invasive specie (rats). • Calsbeek has shown that an invasive species could decrease the genetic diversity of Brown Anole Lizards. • (Evolution is defined as the change of frequency of various alleles for some gene in a given population through time). (Gasc et al. August 10, 2010)
II: Literature Review • The problem in the Calsbeek experiment was not knowing the number of rats found in the area, which could be in a small or broad range. • This could lead unexpected results depending on the number of rats (small to large numbers). • Another problem for the Calsbeek experiment is not knowing the effects of the rats to other species native to the island, to compare biodiversity. (Gasc et al. August 10, 2010)
II: Literature Review • In The Decrease in Biodiversity due to Invasive Species experiment, the frequencies of organisms were calculated, to show the distribution of the two invasive honeysuckle species to other species in Clermont College. • The amount of abiotic input and components will also be measured to determine the effects of these components to the Clermont College Community.
III: Materials and Methods All experimental procedures were used from Professor Janet Carter’s protocols. Protocols listed below: in Ecology Lab Protocol Book • Flora Sampling: Herb Plots (Page 53) • Flora Sampling: Shrub Plots (Page 59) • Soil Analysis (Page 33) • Water Analysis (Page 83) • Environmental Factors (Page 63) (All of Janet Carter’s protocols are assessable online) (Carter May 27, 2009)
1) Flora Sampling: Herb & Shrub Plots Purpose: To determine quantitatively the different kinds of herbs/shrubs present in an ecosystem. Area: Dogwood Grove (2 samples) Herb and Shrub Plots were examined in Dogwood Grove • The boundary of each area were 1m2 for Herbs • The boundary of each area were 16m2 for Shrubs • Plots were by groups counting the number of species of herbs and shrubs. • Relative density analysis was determined for each plot • Distribution analysis was performed by Chi2 test
Picture of Honeysuckle Specimens Figure I- Amur Honeysuckle (Lonicera maackii) Figure II- Japanese Honeysuckle (Lonicera japonica)
2) Soil Analysis Purpose: To determine various components of soil samples Soil collected: Near the “Bubble” building. • Chemical Analysis: Using a testing kit and procedure from LaMotte, the soil was examined for the amount of Nitrogen, Phosphorus, and Potassium. • Subjective Analysis: The soil was analyzed for the percent of clay in each sample. Classifications of soil: “Clay” “Clay-loam”, and loam. Each classification was determined in how well the soil ribbon forming, and how fast it breaks. • Mechanical Analysis was used to get a general idea about the type of soil, using a water suspension, and a sieve with different diameters. Types of soil: very coarse, coarse, medium-grained, fine and very fine.
Soil Analysis Set Up Sieve Lab set up:
3) Water Analysis Purpose: To determine water quality by measuring the hardness, acidity, chloride content and dissolved oxygen content. • Hardness: The hardness of water was determined by doing titrations by measuring the carbonate content. • Acidity of the water was determined by a pH meter with buffer solutions. • Chloride content was measuring after doing a titration of silver nitrate. • Dissolve oxygen content was determined by making an manganese and alkali solution, than was acidified with sulfuric acid.
Water Analysis Set Up: Titration Water Sample
Water Analysis Set Up: Water Sampling in South Maple Creek pH Meter
4) Environmental Factors Purpose: To examine and compare differences in light intensity temperature, humidity, and wind velocity in an area. Areas: Dogwood Grove, Grassy area by maples, Ponds, Southwest Aux. Lot, Former Wetlands, and Bubble bare soil. • Light Intensity was measured with a light meter in the same area and under 3 scales: low, medium and high. • Air Temperature was read by a psychrometer in Celsius. At the dry and wet bulb sides. • Relative Humidity was determined by the sliding scales of the psychrometer. • Soil Temperature was determined by a soil thermometer in the ground in centigrade. • Wind Velocity was measured by a wind meter stick.
Environmental Factors Set Up Psychrometer Light Meter
Environmental Factors Set Up Soil Thermometer Wind Meter
IV: Results From: 1) Flora and Fauna Sampling Found relative density of the honeysuckle
Table of Honeysuckle Density Table I
IV: Results From: 2) Soil Analysis: • Subjective Analysis • Clay loam soil • The ribbon is formed but broke easily, the soil is 27-40% clay.
IV: Results From: 2) Soil Analysis: • Chemical Analysis (LaMotte Soil Test Kit) • pH = 5 • Nitrogen = Low • Phosphorus = Low • Potassium = Heavy
IV: Results From: 2) Soil Analysis: • Mechanical Analysis (from sieve) • 2mm = 0.23 grams • 1mm = 0.52 grams • 500um = 1.07 grams • 250 um = 1.14 grams • 125 um = 1.08 grams • 63 um = 0.48 grams • Bottom = 0.63 grams
IV: Results From: 3) Water Analysis (in Dogwood Grove) • pH = 5.8 • Hardness = 11.0 ppm CaCO3 • Chloride = 0.014 g Cl- / L H2O • O2 content = 5.87 mg O2 / L H2O
IV: Results From: 4) Environmental Factors (From Dogwood Grove) • Light Intensity (foot-candles) • High = 205 • Medium = 60 • Low = 20
IV: Results From: 4) Environmental Factors (From Dogwood Grove) • Light Intensity (milliphot) • High = 220.58 • Medium = 64.56 • Low = 21.52
IV: Results From: 4) Environmental Factors (From Dogwood Grove) • Air Temperature ( °C) • Dry Bulb = 23 • Wet Bulb = 20
IV: Results From: 4) Environmental Factors (From Dogwood Grove) • Relative Humidity (%) • 75
IV: Results From: 4) Environmental Factors (From Dogwood Grove) • Soil Temperature ( °C) • 18
IV: Results From: 4) Environmental Factors (From Dogwood Grove) • Wind Velocity (mph) & (cm/sec) • Head Height =0 =0 • Ground Height = 0 =0
IV: Results • The data collected shows that both honeysuckle species composes about 32.3% of the community together with Amur Honeysuckle with 20.7% relative density and Japanese Honeysuckle (11.6%). • The Chi2 test calculated that Chi2 was 13.495. (distribution analysis) • The Chi2 from table: 3.841
IV: Results • The results from all of the labs combined, shows us that the plants/air/soil/water/ and temperature affected by the local plants and the invasive honeysuckle present. • The environment seems to have the conditions that are ideal for the invaders in this area.
IV: Results • Continued data gathered in this area, on these factors will lead to further results and conclusions for action.
V: Discussion • Overall the data has shown that there are numerous honeysuckle plants in the Clermont wildlife. • The Japanese and Amur Honey suckle roughly composes around 32.3 percent each plot, which could play a role against native species. They were also seen wrapped around the trunks of the tress, to compete for resources. The soil, water and the amount of light was just perfect for them Making it the perfect environment. • The statistical analysis and distribution analysis also suggests that the Japanese Honeysuckle distribution is clumped, but the results might be a little inaccurate since only two plots were done. • This could be later researched for more accurate results, if needed.
V: Discussion • Possible sources of error include the fact that only two plots were censused. To be more accurate, it is suggested that more plots should counted in order to produce more accurate measurements.
V: Discussion • A future experiment could be comprised of comparing the honeysuckle amounts on campus to other locations on campus; or to other areas around Ohio.
VI: References Carter, Janet. Clermont College, "Ecology." Last modified May 27, 2009. Accessed May 24, 2012. http://biology.clc.uc.edu/courses/bio303/index.htm. Gasc, Amandine, M.C. Duryea, Robert M. Cox, Andrew Kern, and Ryan Calsbeek. PLoS Hubs: Biodiversity, "Invasive Predators Deplete Genetic Diversity of Island Lizards." Last modified August 10, 2010. Accessed May 24, 2012. http://www.plosone.org/article/info:doi/10.1371/journal.pone.0012061.