Download
1 / 9
90 likes | 195 Vues
Explore the phenomenon of soliton trains in electron beams through modeling and experimentation, examining nonlinear and dispersive effects. Learn how to control parameters and achieve agreement between theoretical models and real-world data.

E N D
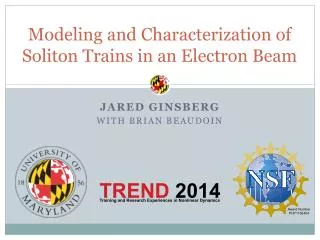
Modeling and Characterization of Soliton Trains in an Electron Beam Jared Ginsberg With Brian Beaudoin
“…The mass of water in the channel… accumulated round the prow of the vessel… then suddenly leaving it behind, rolled forward with great velocity, assuming the form of a large solitary elevation… Such, in the month of August 1834, was my first chance interview with that singular and beautiful phenomenon..” - John Scott Russell The earliest observed solitons were found as water waves Video credit goes to youtube user Christophe FINOT
Nonlinear and Dispersive Effects The initial wave steepens due to nonlinearity. The wave also widens and separates due to dispersion. When balanced these two effects can exactly cancel, yielding a soliton. Image courtesy of Yichao Mo
Experimental Setup for Launching Velocity Perturbations Perturbation at beam tail UMER Beam head Perturbations from Induction Cell 30 cm initial perturbation width Beam Velocity = 5.85 x 10⁷m/s (.2c) Machine Circumference = 11.52 m Circulation Time = 197 ns
What’s so great about a model? • Confirm your choice of equation (KdV!) • Direct control over more parameters • Faster and more portable • Red: computer modeled • Blue: experimental data The Math and The Model Kortewegde-Vries (KdV) nonlinearity dispersion • μ dictates the dispersion strength • Determining ε is a major challenge
Agreement Between Model and Experiment Positive Dispersion ε= 5.85 x 107= beam velocity μ = +42 t = 9 x 197 ns Data with minimal current loss Current (amps) Position (meters) Data with considerable current loss Current (amps)
Agreement Between Model and Experiment Negative Dispersion ε= 5.85 x 107= beam velocity μ = - 42 t = 9 x 197 ns Current (amps) Data with minimal current loss A negative dispersion in the model can then be used to model negative perturbations to the beam that are done in the experiment. Position (meters)
Sub-Pulse Spacing (Future Work) Sub-pulse Spacing vs. Dispersive Coefficient Sub-pulse Spacing vs. Dispersive Coefficient Peak-to-peak Space in meters Peak-to-peak Space in meters Dispersive Coefficient Dispersive Coefficient
Acknowledgements • Brian Beaudoin • Kathryn Tracey, Michelle Girvan, Thomas Murphy, SonaliShukla and the rest of TREND • National Science Foundation