Download
1 / 27
270 likes | 375 Vues
This study explores the design and performance assessment of pedestrian scenarios in driving simulations, aimed at improving driver's safety awareness. In 2003, 4,749 pedestrians were killed by vehicles, underscoring the urgency to create scenarios that allow for safe testing of dangerous driving conditions. The research incorporates various technologies, such as force feedback steering and advanced simulation software, to analyze pedestrian interactions across multiple scenarios. Results indicate that visibility plays a crucial role in collision avoidance, with insights for future studies on pedestrian behavior under different conditions.

E N D
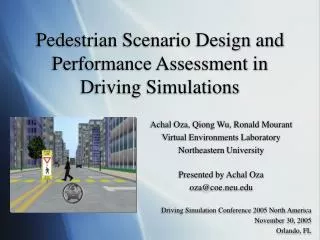
Pedestrian Scenario Design and Performance Assessment in Driving Simulations Achal Oza, Qiong Wu, Ronald Mourant Virtual Environments Laboratory Northeastern University Presented by Achal Oza oza@coe.neu.edu Driving Simulation Conference 2005 North America November 30, 2005 Orlando, FL
Overview • Motivation • Technology • Triggering System • Scenarios and Results • Analysis
Motivation • 4,749 pedestrians were killed in motor vehicle accidents in 2003 • Improve safety by developing scenarios that may be unsafe or impossible to test in a real-world environment • Test subjects for situation awareness, hazard detection, and decision-making
Overview • Motivation • Technology • Triggering System • Scenarios and Results • Analysis
Technology • ‘91 Dodge Caravan • Force feedback steering wheel and pedals • Alienware computerPentium 4 3.4 GHzGeForce 6800 Ultra • Parabolic screen • 1024 x 768 resolution30° horizontal field of view
Overview • Motivation • Technology • Triggering System • Scenarios and Results • Analysis
Pedestrian Model • MD2 file format (originally developed for Quake 2) • Two types of animations: • Walking • Idling
Triggering System • An object’s action is triggered by another object performing a specified action • Pedestrians use two type of triggers: • Traffic lights • User vehicle
Triggering SystemTraffic Light Triggers • The pedestrian is bound to a traffic light • Walking is triggered by a green light • Continues walking even after light change back to red
Triggering SystemUser Vehicle • Pedestrian is bound to the user vehicle • Walking is triggered when the vehicle enters a specified radius
Overview • Motivation • Technology • Triggering System • Scenarios and Results • Crosswalk Scenario • Intersection Dash Scenario • Vehicle Turning Scenario • Bus Stop Scenario • Analysis
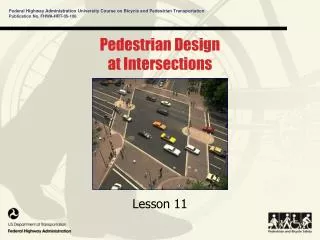
Crosswalk Scenario • Crosswalk with a yield-to-pedestrians sign • Crossing starts when driver is 225 feet away • High pedestrian visibility
Results for Crosswalk Scenario • 8 out of 10 subjects avoided a collision • Stopped near crosswalk • Good Time-To-Collision estimate • The remaining two slowed down after collision
Overview • Motivation • Technology • Triggering System • Scenarios and Results • Crosswalk Scenario • Intersection Dash Scenario • Vehicle Turning Scenario • Bus Stop Scenario • Analysis
Intersection Dash Scenario • Driver waits at an intersection for a red light to turn green • Pedestrian illegally crosses after the driver enters the intersection
Results for Intersection Dash Scenario • 6 out of 10 subjects avoided a collision • The remaining four ran through the red light
Overview • Motivation • Technology • Triggering System • Scenarios and Results • Crosswalk Scenario • Intersection Dash Scenario • Vehicle Turning Scenario • Bus Stop Scenario • Analysis
Vehicle Turning Scenario • Pedestrian crosses in front of the user vehicle while making a left turn at an intersection • High pedestrian visibility
Results for Vehicle Turning Scenario • 6 out of 10 subjects stopped before reaching the pedestrian • Remaining four slowed down, without completely stopping, allowing the pedestrian to safely cross
Overview • Motivation • Technology • Triggering System • Scenarios and Results • Crosswalk Scenario • Intersection Dash Scenario • Vehicle Turning Scenario • Bus Stop Scenario • Analysis
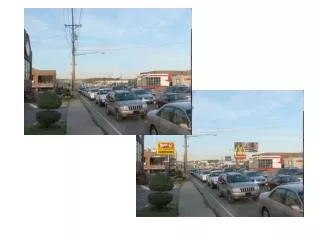
Bus Stop Scenario • Initially obstructed from view by a bus • Jaywalker enters street when driver is within 130 feet • Minimal pedestrian visibility
Results for Bus Stop Scenario • 10 out of 10 subjects collided with the pedestrian • 4 out of 10 stopped after the collision
Overview • Motivation • Technology • Triggering System • Scenarios and Results • Analysis
Scenario Analysis • Scenarios ranked from safe to dangerous: • Crosswalk • Vehicle Turning • Intersection Dash • Bus Stop • Safety increases when visibility increases
Future Study • Focus on varying pedestrian visibility • Larger sample sizes and more test groups • Experienced and inexperienced drivers • Add intelligence to the pedestrians • Hesitate when crossing in a dangerous area • Collect real-world data for validation (where possible) • Use a variety of pedestrian models • Children, the elderly, etc.
References 1. NHTSA, (2004). Traffic Safety Facts 2003-National Highway Traffic Safety Administration 2. Kenneth R. Laughery, Theodore E. Anderson & Edwin A. Kidd (1967). “A computer simulation model of driver-vehicle performance at intersection.” Proceeding of the 1967 22nd national conference. ACM Press. New York, NY, USA. 3. Dirk Helbing. (1992) “Model for Pedestrian Behavior.” Pages 93-98 in: Natural Structures. Principles, Strategies, and Model in Architecture and Nature, Part II. 4. Staplin, L., K. Lococo, and S. Byington. “Older Driver Highway Design Handbook.” The Scientex Corporation – Transportation Safety Division, Pennsylvania 19443, FHWA-RD-97-135, January 1998. 5. Gale, A.G., et al. “Time-To-Collision As A Cue For Decision-Making in Braking.” Vision in Vehicles. Vol. 3, 1991, pp. 19-26. 6. Hoffman, Errol R., and Rudolf G. Mortimer. “Drivers’ Estimates Of Time To Collision.” Accid Anal Prev, Vol. 26, No. 4, 1994, pp. 511-520.
Questions? Achal Oza oza@coe.neu.edu Virtual Environments Laboratory Northeastern University