ARRAY DESIGN AND SIMULATIONS
ARRAY DESIGN AND SIMULATIONS. Craig Walker NRAO Based in part on 2008 lecture by Aaron Cohen. TALK OUTLINE STEPS TO DESIGN AN ARRAY. Clarify the science case Determine the technical requirements for the key science Specify the resolution, field of view, sensitivity, frequency range

ARRAY DESIGN AND SIMULATIONS
E N D
Presentation Transcript
ARRAY DESIGN AND SIMULATIONS Craig Walker NRAO Based in part on 2008 lecture by Aaron Cohen
TALK OUTLINESTEPS TO DESIGN AN ARRAY • Clarify the science case • Determine the technical requirements for the key science • Specify the resolution, field of view, sensitivity, frequency range • Specify the antenna type, size, and performance • Choose site • Design and optimize the configuration • Also required, but not covered: • Design feeds, receivers, LO/IF systems, data transmission • Design a correlator • Find money Twelfth Synthesis Imaging Workshop
SCIENCE REQUIREMENTS • No one array can do everything. What is yours for? • Extreme examples: • Epoch or reionization requires low resolution, low frequency • Star formation, black holes, accretion disks and jet launch require high resolution and high frequency • Determine the technical requirements of each major element of the science case • Generate specifications for the array based on the science drivers • Don’t be surprised when the actual science done differs from the Science case. • Make the array flexible. Twelfth Synthesis Imaging Workshop
CASE STUDYSKA KEY SCIENCE DRIVERS • SKA project identified 5 key science drivers • Cradle of Life • Astrobiology, planet detection, SETI • Probing the Dark Ages • Epoch of reionization, redshifted CO, first AGNs • The origin and evolution of Cosmic Magnetism • Strong field tests of gravity using pulsars and black holes • Galaxy evolution, cosmology and dark ages • (Exploration of the Unknown) Twelfth Synthesis Imaging Workshop
TECHNICAL REQUIREMENTS OF SKA KEY SCIENCE PROJECTS • A very big array with very broad capabilities is required to do everything! • Cost in billions of dollars. Twelfth Synthesis Imaging Workshop
RESOLUTION • Resolution = /Bmax • High resolution is used to study hot or non-thermal sources and for astrometry • Requires high frequencies and long baselines • Radio arrays can use unlimited baseline lengths • VLBI commonly uses baselines up to near an Earth diameter • Longer baselines possible with spacecraft (HALCA) • Low resolution is required to see low brightness sources • Brightness temperature S =2kTB/ 2 • is set by the smaller of the beam and the source • To detect low apparent TB sources, need large (short baselines) • Cannot detect low brightness, compact sources - too weak • A general purpose instrument will need a wide range of resolutions Twelfth Synthesis Imaging Workshop
EXTREME BASELINE EXAMPLES • ALMA compact configuration • Good for large, diffuse sources • VLBA - Continental or more in scale • Good for very high brightness sources and astrometry. Twelfth Synthesis Imaging Workshop
SENSITIVITY AND SURVEY SPEED • The sensitivity and survey speed requirements will determine the scale and cost of the array • Sensitivity depends on collecting area, system temperature and bandwidth (Nant D2 / Ts) 0.5 • This is what matters for sources smaller than a beam • For observations over many beam areas, the “survey speed” matters • Field of view times sensitivity squared • Nbeams2 (Nant D / Ts)2 • Nbeams is the number of independent primary beams • Maximize for surveys • Maximize for sources that are large - big mosaics • Favor small antennas and multiple beams Twelfth Synthesis Imaging Workshop
FIELD SIZE • Reasons for large fields of view: • Surveys - want to cover lots of sky • Large sources (galactic clouds, nearby galaxies etc) • Reasons for small fields of view: • Less trouble with confusion • Fewer baselines required, easier processing • Can afford more sensitive receivers, wider bandwidth etc. • For wide fields: • Small antennas with large beams - but need many • Multiple beam receiving systems - lots of electronics • For small fields can use large individual antennas • But cost scales faster than area, so don’t go too big Twelfth Synthesis Imaging Workshop
FIELD SIZE EXAMPLES • EVLA: 25m antennas - primary beam 30’ at 1.4 GHz. • Good for sensitivity and wide frequency coverage • Slow for surveys • ALMA: 50 X 12m antennas + 12 X 7m antennas (+ 4 X 12m for total power) • Compromise between sensitivity for extragalactic sources vs ability to observe large galactic objects. • The 7m antennas (plus 4 X 12m antennas) were brought in later by Japan to do large sources • VLBA: 10 X 25m antennas, but individual fields limited by delay and rate smearing to a few arcseconds. Not for blind surveys! • LWA, MWA, LOFAR: Fixed aperture arrays. In principle, with enough electronics, could observe the whole sky. • WSRT, ASKAP: Feed arrays for multiple beaming Twelfth Synthesis Imaging Workshop
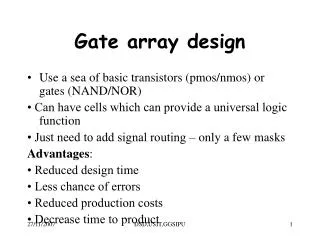
COST VS ANTENNA DIAMETER • Traditional antenna cost scales as D2.7 • Number of antennas scales as D-2 for constant area • Total cost for all antennas scales as D0.7 Favors smaller antennas. • But many items scale with Nant andNbeams • Receiver electronics, LO/IF, data transmission, station sections of correlator • Baseline sections of correlator scale with Nbeams and Nant2 • Optimum has a broad minimum favoring 10 to 20 m antennas. Twelfth Synthesis Imaging Workshop
FREQUENCY RANGE • The frequency range strongly influences the type and cost of the antennas and receivers • Low frequencies (< 3 GHz very roughly) • Less demanding for accuracy • Can get large collecting area at low cost • Can use aperture arrays of fixed elements • Limited by ionosphere at low end • High frequencies (> 3 GHz very roughly) • Almost certainly will use dishes and cryogenic receivers • Higher frequencies require more accurate surfaces • High demands on pointing accuracy • Complicated choice - still not clear for SKA Twelfth Synthesis Imaging Workshop
ANTENNA TECHNOLOGIES • MWA 80-300 MHz. Steered by phasing fixed elements • MeerKAT prototype 15m composite antenna (South Africa) Twelfth Synthesis Imaging Workshop
LOCATION • Location is an important decision with large performance, operations, financial, and political considerations • At high frequencies, want high altitude and dry climate (ALMA) • At low frequencies, want protection from RFI (SKA) • At low frequencies, avoid regions with worst ionosphere (SKA etc) • Site must be large enough to accommodate the array • Need reasonable access and place to live for staff and their families • Not everyone can work remotely • Need power, communications. Expensive if need to provide own, especially to outer stations. Twelfth Synthesis Imaging Workshop
IONOSPHERE • Can seriously complicate the calibration of low frequency data • Concentrated near the subsolar point but on the geomagnetic equator Twelfth Synthesis Imaging Workshop
TROPOSPHERE • At high frequencies, the troposphere is the main problem for calibration • The tropospheric delay is dominated by the dry atmosphere • But that is fairly stable • Water vapor is highly variable, so limits phase stability • For a high frequency array, chose a site with low water vapor • Want an arid location at high altitude • EVLA at 2114 m • ALMA at 5000 m in the Atacama Desert • Want phase stability • Usually, but not always correlates with opacity Twelfth Synthesis Imaging Workshop
RADIO FREQUENCY INTERFERENCE • RFI is a big problem especially on short baselines at low frequencies. • Non-closing corruption of data • Time variable • Corruption of spectra • It is becoming more of a problem at high frequencies • Want isolation from civilization • Want terrain shielding (surrounding mountains good) • Can’t hide from satellites • Problem is reduced for long baselines • Sources different at each antenna - done correlate • Attenuated by high fringe rates (differential Doppler shifts) • But can saturate receivers Twelfth Synthesis Imaging Workshop
RFI EXAMPLES Twelfth Synthesis Imaging Workshop
SITE CONSTRAINTS • Site issues vary on different scales • For short baselines (10s of km), want large flat area • Full freedom to position antennas as desired • For 10s to 100s of km, will need individual sites • Need to conform to power, communication, road access • Need to avoid cities, wilderness areas, military areas • The sites will need to be within a few km of the desired position for the configuration, but many configurations work • For long baselines, site position not critical to 10s or 100s of km • Usually can find some place that works • Main constraints are major geographic features like oceans Twelfth Synthesis Imaging Workshop
NUMBER OF ANTENNAS AND SITES • Sensitivity issues • Required sensitivity • Required field of view or survey speed • Cost optimization • Imaging issues • Required baseline range and UV coverage • Types and complexity of target sources • Impact of confusion • Each antenna separate or clusters? • May depend on distance from center • May be cost and correlator size driven Twelfth Synthesis Imaging Workshop
RECONFIGURE? • Allows wide baseline range with fewer antennas • VLA 1km to 35km arrays - 27 antennas but 72 pads • Constrains observing to certain times by resolution • Requires some sort of transporter - picture is ALMA • SKA not planned to reconfigure • “Configurations” (VLA) vs continuous zoom (ALMA) Twelfth Synthesis Imaging Workshop
CONFIGURATION • Must determine where to put the antennas • Goals • Obtain adequate UV coverage to meet the scientific goals • Minimize cost - probably means minimize separate stations • Constraints • Available geography • Available infrastructure (power, communication, roads) • What are the required properties and capabilities? • Snapshot coverage or only full tracks • Brightness sensitivity and resolution range • Implies baseline range • Centrally condensed or more uniform distribution • Reconfigurable? • Once configuration is chosen, can’t freely move individual antennas • Optimizing baselines Twelfth Synthesis Imaging Workshop
UV COVERAGE: SINGLE SHORT BASELINE A single baseline has a sinusoidal sensitivity pattern across the sky, oscillating between constructive and destructive interference. Twelfth Synthesis Imaging Workshop
UV COVERAGE: SINGLE LONG BASELINE The oscillations in the sensitivity pattern have the same direction as the baseline, with a period determined by the baseline length in wavelengths Twelfth Synthesis Imaging Workshop
UV COVERAGE: SNAPSHOT The uv-coverage is the set of all baseline vectors. The synthesized beam (PSF) is the sensitivity pattern of all baselines. Twelfth Synthesis Imaging Workshop
UV COVERAGE: SHORT TRACK 1 Hour Synthesis Observation Twelfth Synthesis Imaging Workshop
UV COVERAGE: MEDIUM TRACK 3 Hour Synthesis Observation Twelfth Synthesis Imaging Workshop
UV COVERAGE: FULL TRACK 12 Hour Synthesis Observation Twelfth Synthesis Imaging Workshop
EXAMPLES: Westerbork Synthesis Radio Telescope • Located in Westerbork, Holland • Has 14 antennas, 25m diameter • East-West Array • Requires Earth Rotation Synthesis for all imaging • Dedicated in 1970: one of the earliest major interferometric arrays Twelfth Synthesis Imaging Workshop
EXAMPLES: Westerbork Synthesis Radio Telescope UV Coverage WSRT uv-coverage at various declinations Twelfth Synthesis Imaging Workshop
EXAMPLES: Very Large Array (VLA) • Y-shaped Array • Re-configurable Config. Bmax (km) Bmin (km) A 36 0.68 B 11 0.24 C 3.4 0.045 D 1.0 0.035 Twelfth Synthesis Imaging Workshop
EXAMPLES: Very Large Array (VLA) UV Coverage - Long Track VLA uv-coverage at various declinations Twelfth Synthesis Imaging Workshop
EXAMPLES: Very Long Baseline Array (VLBA) • Ten 25m antennas • US Territory, Hawaii to St. Croix • Baselines 200 to 8,600 km • Elements not connected • Separate clocks • Data recorded • Resolution of milli-arcseconds Twelfth Synthesis Imaging Workshop
EXAMPLES: VLBA UV Coverage VLBA uv-coverage at various declinations Twelfth Synthesis Imaging Workshop
VARIOUS “IDEAL” ARRAY DESIGNS Circular maximizes number of long baselines Spiral has more short baselines Random has little redundancy or patterns Circular Design: N = 45 Spiral Design: N = 45 Random Design: N = 45 Twelfth Synthesis Imaging Workshop
Centrally Condensed Array • Plots for EVLA2 (NMA) • VLA + 10, to 300km • Mainly baselines from outer stations to core count • SKA will be centrally condensed Twelfth Synthesis Imaging Workshop
LARGE-N / SMALL-D CONCEPT • N = Number of antennas in array • D = Diameter of an antenna • Collecting area (N D2) kept constant • UV Coverage drastically improved keeping sensitivity constant • Number of baselines scales with N2 • Field of view large - better for survey speed • Antennas relatively inexpensive - cost effective way to get area • But the electronics are more complicated and expensive • Many more receivers, LOs, data lines etc • Correlator scales with N2 • ATA is exploring the concept • SKA will likely use it with several thousand antennas Twelfth Synthesis Imaging Workshop
SKA CONCEPTUAL CONFIGURATION • About 3000 antennas • Core of 5 km diameter • Dense array of 1500 individual antennas • Skirt 2.5 to 15 km radius • Transition to spirals • 372 antennas • Intermediate region 2.5-180 km • Skirt is inner part • 528 antennas in clumps of 11 beyond skirt • Remote region 180-3000+ km • 600 antennas in clumps of 24 • Displays from AntConfig - program being used to derive SKA configuration Twelfth Synthesis Imaging Workshop
SKA CONCEPTUAL CONFIGURATION • About 3000 antennas • Core of 5 km diameter • Dense array of 1500 individual antennas • Skirt 2.5 to 15 km radius • Transition to spirals • 372 antennas • Intermediate region 2.5-180 km • Skirt is inner part • 528 antennas in clumps of 11 beyond skirt • Remote region 180-3000+ km • 600 antennas in clumps of 24 • Displays from AntConfig - program being used to derive SKA configuration Twelfth Synthesis Imaging Workshop
SKA CONCEPTUAL CONFIGURATION • About 3000 antennas • Core of 5 km diameter • Dense array of 1500 individual antennas • Skirt 2.5 to 15 km radius • Transition to spirals • 372 antennas • Intermediate region 2.5-180 km • Skirt is inner part • 528 antennas in clumps of 11 beyond skirt • Remote region 180-3000+ km • 600 antennas in clumps of 24 • Displays from AntConfig - program being used to derive SKA configuration Twelfth Synthesis Imaging Workshop
SKA CONCEPTUAL CONFIGURATION • About 3000 antennas • Core of 5 km diameter • Dense array of 1500 individual antennas • Skirt 2.5 to 15 km radius • Transition to spirals • 372 antennas • Intermediate region 2.5-180 km • Skirt is inner part • 528 antennas in clumps of 11 beyond skirt • Remote region 180-3000+ km • 600 antennas in clumps of 24 • Displays from AntConfig - program being used to derive SKA configuration Twelfth Synthesis Imaging Workshop
SKA CONCEPTUAL CONFIGURATION • About 3000 antennas • Core of 5 km diameter • Dense array of 1500 individual antennas • Skirt 2.5 to 15 km radius • Transition to spirals • 372 antennas • Intermediate region 2.5-180 km • Skirt is inner part • 528 antennas in clumps of 11 beyond skirt • Remote region 180-3000+ km • 600 antennas in clumps of 24 • Displays from AntConfig - program being used to derive SKA configuration Twelfth Synthesis Imaging Workshop
Array Optimization Trial and Error devise configurations and calculate metrics (works OK for small N) Random Distribution Lack of geometric pattern reduces redundancy Works surprisingly well for large N Simulated Annealing (Cornwell) Define uv ‘energy’ function to minimize – log of mean uv distance UV-Density & pressure (Boone) Steepest descent gradient search to minimize uv density differences with ideal uv density (e.g., Gaussian) Genetic algorithm (e.g., Cohanim et al.,2004) Pick start configurations, breed new generation using crossover and mutation, select, repeat PSF optimization (L. Kogan) Minimize biggest sidelobe using derivatives of beam with respect to antenna locations (iterative process) Twelfth Synthesis Imaging Workshop
Metrics for Optimization Side-lobe levels Useful for image dynamic range Range of baseline lengths Useful for large complex sources Useful for ability to support a wide variety of science Largest gaps in uv-coverage Image fidelity Match to desired baseline length distribution So that UV-weighting, which reduces sensitivity, is not needed Twelfth Synthesis Imaging Workshop
Iterative Minimization of Sidelobes: Kogan Method Comparing random versus optimized arrays for N = 271 Twelfth Synthesis Imaging Workshop
MASK • In the optimization, a mask can be used to define acceptable places to put antennas • Example is for ALMA • Pads can go in the white areas • Preparation of a mask is an important step • Time consuming to get all the required data Twelfth Synthesis Imaging Workshop
Simulations Simulations provide a good test and demonstration of an array design Show how well the UV-coverage performs in practice Can explore “fidelity” since the “true” image is known Provide material to help sell the array Steps for a simulation: Generate realistic models of sky Simulate data, adding in increasing levels of reality Atmosphere, pointing errors, dish surface rms etc. Process simulated data & compare final images for different designs and configurations – relative comparison Compare final images with input model Tests image fidelity which cannot be done with real data Compare with specifications for DR and fidelity Be careful that you are not just testing imaging methods rather than array design - imaging is a complicated process Twelfth Synthesis Imaging Workshop
Simulating the Long Wavelength Array (LWA) Simulating Image Fidelity Project model image to simulated uv-coverage and image in normal way Subtract model to examine residual image errors Can define: Fidelity Index = (peak intensity)/(residual rms) Simulated LWIA Image (74 MHz) Cygnus A at 325 MHz with VLA A-configuration + PT Residual Map (model subtracted) Twelfth Synthesis Imaging Workshop
Simulation Software • Most analysis packages have basic simulation capabilities • AIPS - Basic fake data creation with full imaging and analysis • CASA - simdata and sm • Can simulate many arrays. including ALMA, EVLA, CARMA, SMA, ATCA, PdB …. • MeqTrees - Implements measurement equations • Used especially for LOFAR • IRAM/GILDAS ALMA simulator • Many more Twelfth Synthesis Imaging Workshop
THE END Twelfth Synthesis Imaging Workshop