Download
1 / 14
140 likes | 306 Vues
Wal-Mart Carlos Lamar 002. Annual Report Project Directions : DURING THE CLASS THAT COVERS CHAPTER 15, GET PROFESSOR APPROVAL FOR THE COMPANY YOU WANT TO ANALYZE.

E N D
Wal-MartCarlos Lamar002 Annual Report Project Directions: DURING THE CLASS THAT COVERS CHAPTER 15, GET PROFESSOR APPROVAL FOR THE COMPANY YOU WANT TO ANALYZE. PREPARE A POWERPOINT PRESENTATION: Modify and enhance this powerpoint template—replace any italicized words in this template with your own. Add images, tables, backgrounds, etc. !!! THIS TEMPLATE IS BASED ON THE ANNUAL REPORT PROJECT PARTS A-E (OPTION C-exclude cash flow adequacy, pages 56-58) IN TEXT. SAVE YOUR PROJECT AS A WEB PAGE--NAME YOUR FILE YOUR THREE INITIALS AND YOUR COMPANY NAME. BE SURE YOUR WEBPAGE INCLUDES A LINK TO THE CORPORATIONS' F/S! SEND YOUR WEB-READY PRESENTATION AS AN E-MAIL ATTACHMENT TO susan.crosson@sfcc.edu BY THE DUE DATE LISTED IN COURSE CALENDAR. ALL SUBMISSIONS WILL BE POSTED ON OUR COURSE WEBSITE. THE ANNUAL REPORT PROJECT IS WORTH 18 POINTS.
Executive Summary After completing your analysis, write an executive summary of your conclusions here…. Based on the last two years, it seems that Wal-Mart will continue to prosper and grow. With the support of the supplier and the purchase made by the consumers Wal-Mart profit should continue to flourish. Wal-Mart will also continue to progress if liabilities and the cost of operation do not exceed the net income. Walmart.com
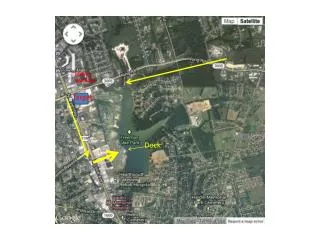
Part A. Introduction • Name of chief executive officer Eduardo Castro-Wright • Location of home office 702 SW 8th street Bentonville, Arkansas 72716 • Ending date of latest fiscal year January 31, 2005 • Description of the principal products or services that the company provides Wal-Mart provides general merchandise, such as cloths, toys, and house hold appliances, and also a full line super market, all at discounted prices. • Main geographic area of activity Wal-Mart activity area mainly consist of well populated cities.
Part A. Audit Report • Name of the company’s independent auditors. Ernst and Young LLP are Wal-Mart’s independent auditors. • In your own words, what did the auditors say about the company? Auditors stated that Wal-mart had a “solid performance”. They believe Wal-mart will be profitable for years to come.
Part A. Stock Market Information • Most recent price of the company’s stock $45.37 • Twelve month trading range of the company’s stock $42.31-$53.36 • Dividend per share $.63 • Date of the above information march 2 • Your opinion about the company stock as an investment? HOLD
Part B. Industry Situation and Company Plans In your own words, describe the industry and its outlook; then summarize the company’s future plans based on your research (cite at least two sources) and on reading the annual report (be sure to read the letter to the stockholders). Include links to any relevant information.
Part C. Income Statement Multistep Insert a table showing the company’s gross profit, income from operations, and net income for the last two years. Is the format most like a single-step or multistep format? gross profit $77,335 income from operations $16,105 net income 2004 $9,054 2005 $16,267 Based on the significant difference in net income from 2004 to 2005 Wal-Mart must may have changed its way of advertising or decreased it liabilities causes an increase in its net income.
Part C. Balance Sheet Insert a table showing that Assets=Liabilities + Stockholders’ Equity for the past two years. (in millions)05Asset: Current asset $38,491 = Liabilities: + SHE: PPE $84,045 Current liabilities $42,888 SHE $49,396 Capital $3,159 ect. Total asset $120,223 (in millions)04Asset: Current asset $34,421 = Liabilities: + SHE: PPE $72,094 Current liabilities $37,840 SHE $43,623 Capital $2,613 ect. Total asset $105,405 In your own words, comment in general on the increases or decreases in the balance sheet accounts. Which accounts changed the most? stockholders equity
Part C. Statement of Cash Flows Are cash flows from operations more or less than net income for the past two years? Cash flows from operation is more than net income for the past two years. Is the company growing through investing activities, i.e., buying property, plant and equipment and other long lived assets? Yes the company is growing trough investing. Base on the last two years the spent more in investing and they earn more money What is the company’s primary source of financing, i.e., long-term loans, stock sales? Stock sale Overall, has cash increased or decreased over the past two years? The cash has increased over the past two years.
Part D. Accounting Policies What are the significant accounting policies, if any, relating to revenue recognition, cash, short-term investments, inventories, and property and equipment? List the topics of the notes to the financial statements. Working capital Liquidity and capital resources Common stock and dividends
Part E. Financial AnalysisLiquidity Ratios For the past two years, calculate and comment on: • Working Capital 20052004 4.4 million 3.4 million • Current Ratio .9 .9 • Receivable turnover 12.02 9.63 • Average days’ sales uncollected 30.34 37.89 • Inventory turnover 3.92 7.46 • Average days’ inventory on hand 93.11 48.92 Progress since the previous year.
Part E. Financial AnalysisProfitability Ratios For the past two years, calculate and comment on: • Profit margin 20052004 .03 .03 • Asset turnover 1.26 2.43 • Return on assets .04 .08 • Return on equity .11 .08 Could have done much better.
Part E. Financial AnalysisSolvency Ratio For the past two years, calculate and comment on: • Debt to equity 20052004 .08 .20 Progress since the previous year.
Part E. Financial AnalysisMarket Strength Ratios For the past two years, calculate and comment on: • Price/earnings per share 20052004 33.87 • Dividend yield 1.1 1