Matchstick Puzzles and Outlier Identification - Fun Challenges and Statistics Lesson
Enjoy solving matchstick puzzles and learn to identify outliers in sets of numbers using the Interquartile Range method. Test your skills with creative challenges and enhance your statistical knowledge in an interactive way.

Matchstick Puzzles and Outlier Identification - Fun Challenges and Statistics Lesson
E N D
Presentation Transcript
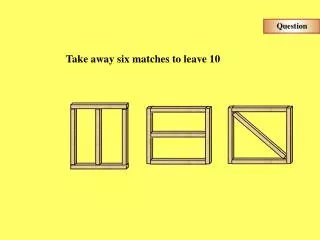
Question Take away six matches to leave 10
Question • Take away four matchsticks to leave exactly four • small equilateral triangles.
Question • Can you move two matches to make 7 squares.
Question • Take away two matches to leave two squares.
Question • Arrange four matches and a coin as shown below • to represent a glass containing a cherry. By moving two matches only, remove the cherry from the glass, but leave the glass intact.
Question • Move one match to leave a square Square
Problem Number 5 How many moves to get the cherry outside of the fancy glass?
Outliers To be able to identify an outlier using the Inter Quartile Range
What is an outlier? • In a set of numbers, a number that is much LARGER or much SMALLER than the rest of the numbers is called an Outlier.
Say we have the following data:1,2,5,5,7,8,10,11,11,12,15,20 • Find the median first. It’s the middle point. • Then find the quartiles, Q1 and Q3. They are the middles of the lower and upper half, respectively. • The last thing to do is determine whether there are outliers using the 1.5*IQR Rule
min Q1 Q3 max 1,2,5,5,7,8,10,11,12,12,18,25 M 1 5 9 12 18 25 -5.5 22.5 1.5IQR IQR = 12 – 5 = 7 1.5IQR 5 - 1.5 * 7 = -5.5 12 + 1.5 * 7 = 22.5 25 is considered an outlier and will be a point in a boxplot and the ‘whisker’ ends at the last non-outlier data point.
Do any of these sets of data have outliers • 21, 27, 31, 35, 29, 42, 45, 50, 54, 61, 69 • 108, 134, 141, 152, 153, 157, 159, 160, 160, 160, 161, 162, 167, 169, 173 • 4, 4, 4, 5, 5, 5, 7, 9, 11, 13, 15, 33 • 6, 7, 7, 8, 8, 9, 11, 12, 13, 15, 18 • 4, 4, 7, 7, 8, 8, 8, 9, 9, 11, 13 • HINT – Use the IQR