Directional Statistics
Directional Statistics. Data in degrees or coordinates. Directional Statistics. North, Northeast, 30°, 215°, etc Standard descriptive statistics are misleading Anything measured in degrees Any cyclic data: daily, weekly, monthly, or yearly Mathematical vs Geographic standards. Orientation.

Directional Statistics
E N D
Presentation Transcript
Directional Statistics Data in degrees or coordinates
Directional Statistics • North, Northeast, 30°, 215°, etc • Standard descriptive statistics are misleading • Anything measured in degrees • Any cyclic data: daily, weekly, monthly, or yearly • Mathematical vs Geographic standards
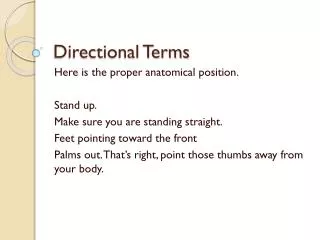
Orientation • North/South, East/West • Orientation ignores directionality (e.g. “Texas Avenue runs both ways.”) • Mostly roads, paths, and other transportation links
Testing for Direction • Rayleigh’s Test for directionality • Chi-Square Test for even distribution • For orientation data, we double the value and use the directionality tests
Mean Direction • Convert to rectangular form: • x = cos , y = sin [may need to convert degrees to radians] • Sum coordinates: • C = (cos i), S = (sin i) • Mean depends on sign of C, S
Allen’s Creek Cemetery Circular Mean = 43.6° 34 35 10 13 4 2 2 16 6 17 Mean = 126.1°
Rayleigh’s Test • Null hypothesis of uniformity (or bimodal opposing directions) • Based on mean angle and Rayleigh’s spread:
Chi Square • Divide data into groups: 4, 8, etc • Calculate simple Chi Square test • This ignores circular nature of the data, but provides a rough guide to finding differences
Package circular 1 • Circular object class holds information about the kind of circular data being used: • units – radians, degrees, or hours • zero – location of zero point • rotation – clockwise or counterclockwise • templates set both zero and rotation
Package circular 2 • Descriptive statistics adjusted for circular data • Plotting circular plots, density plots, rose, and windrose plots • Statistical tests for directionality, regression, and comparing samples
Example • Ernest Witte has two directional variables: • Direction (direction the spinal column head is pointing toward) • Looking (direction eyes are looking toward) • They are stored as geographic data (degrees clockwise from north)
> library(circular) > dir <- circular(ErnestWitte$Direction, units="degrees", template="geographics") > look <- circular(ErnestWitte$Looking, units="degrees", template="geographics") > mean(dir, na.rm=TRUE) Circular Data: Type = angles Units = degrees Template = geographics Modulo = asis Zero = 1.570796 Rotation = clock [1] 43.62221 > mean(ErnestWitte$Direction, na.rm=TRUE) [1] 126.0643
> mean(look, na.rm=TRUE) Circular Data: Type = angles Units = degrees Template = geographics Modulo = asis Zero = 1.570796 Rotation = clock [1] 184.7019 > mean(ErnestWitte$Look, na.rm=TRUE) [1] 173.9577 > plot(dir) > plot(look) > plot(dir, main="Head/Body Direction") > plot(look, main="Direction Looking“) > rose.diag(dir, bins=6, prop=1.1, col="gray") > rose.diag(look, bins=6, prop=1.2, col="gray")
Rose Plot with Circular Plot and Kernel Density Plot
> rayleigh.test(dir) Rayleigh Test of Uniformity General Unimodal Alternative Test Statistic: 0.4806 P-value: 0 > rayleigh.test(look) Rayleigh Test of Uniformity General Unimodal Alternative Test Statistic: 0.07 P-value: 0.7062