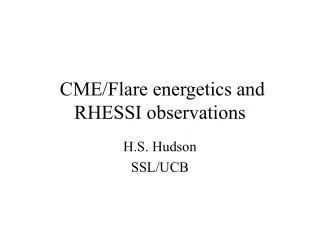
Hinode Coordinated Observations: Flare Turbulence
30 likes | 178 Vues
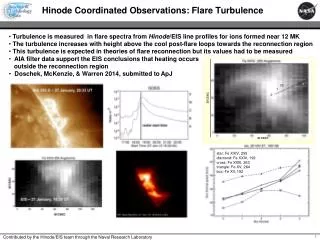
Hinode Coordinated Observations: Flare Turbulence. Turbulence is measured in flare spectra from Hinode /EIS line profiles for ions formed near 12 MK The turbulence increases with height above the cool post-flare loops towards the reconnection region

Hinode Coordinated Observations: Flare Turbulence
E N D
Presentation Transcript
Hinode Coordinated Observations: Flare Turbulence • Turbulence is measured in flare spectra from Hinode/EIS line profiles for ions formed near 12 MK • The turbulence increases with height above the cool post-flare loops towards the reconnection region • This turbulence is expected in theories of flare reconnection but its values had to be measured • AIA filter data support the EIS conclusions that heating occurs • outside the reconnection region • Doschek, McKenzie, & Warren 2014, submitted to ApJ Contributed by the Hinode/EIS team through the Naval Research Laboratory
Hinode Coordinated Observations: Observing Coronal Heating Hinode has provided the first complete description of active region temperature structure. EIS observations of Ca XIV, XV, XVI, and XVII have been particularly important for showing that the temperature distribution in the core of an active region is strongly peaked at around 4 MK. To further probe the nature of the heating at these temperatures EIS and AIA Fe XVIII observations have been combined. Such observations make use of the high cadence of AIA for measuring the evolution of individual events while the spectroscopic data from EIS provides a precise description of the plasma properties. These observations are being used to constrain hydrodynamic simulations of the coronal heating process. (above) An example of a heating event observed with EIS and AIA. The left panels show the EIS and AIA images of the active region. The right panels show the time evolution of the intensities. (right) Heating event statistics determined from AIA. The panels show the intensity, every pixel where an event has been detected, and the relative phase of the event. See: Ugarte-Urra & Warren, ApJ, 783, 12, 2014. Contributed by the Hinode/EIS team through the Naval Research Laboratory
Hinode Coordinated Observations: Coronal Hole Jets • Coronal hole jets associated with bright points have been observed with Hinode and SDO/AIA • A small blowout jet observed on 8 February 2011 had a temperature of 1.6 MK and electron density of 0.9-1.7 x 108 cm-3. It lasted 25 minutes and extended 30 Mm from the bright point. Line-of-sight velocities reached 250 km s-1. No bright point plasma exceeded a temperature > 3 MK. • Key point: The jet was triggered by cancellation of a weak, positive polarity magnetic feature that moves towards the negative pole of the bipole. Intensity and Doppler maps of the jet and associated bright point. The contours in c-e define the location of the bright point. The intensity images are negatives. Panels b-c refer to the primary Gaussian component of the Fe XII 195.12 Å line. Panels d-e refer to the secondary component. Two-Gaussian fits to the Fe XII line profile. Red profiles are for the primary component; blue profiles are for the secondary component. Pixel numbers are X- and Y-pixels in d-e above (crosses). Intensity and Doppler speed for the primary (red) and secondary (blue) components at X-pixel 6 in a-e, as a function of Y-pixel. The horizontal line in j is the coronal hole background intensity level. See: Young & Muglach 2014, Publ. Astron. Soc. Japan, in press. Contributed by the Hinode/EIS team through the Naval Research Laboratory