Using Evapotranspiration Data in Idaho
280 likes | 690 Vues
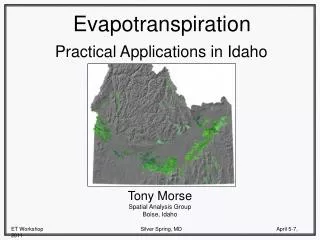
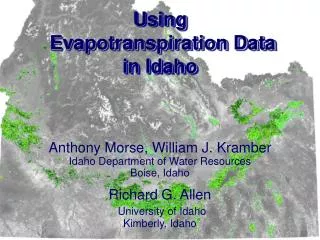
Using Evapotranspiration Data in Idaho. Anthony Morse, William J. Kramber Idaho Department of Water Resources Boise, Idaho Richard G. Allen University of Idaho Kimberly, Idaho. METRIC. M apping E vapo T ranspiration with high R esolution and I nternalized C alibration. OUTLINE.

Using Evapotranspiration Data in Idaho
E N D
Presentation Transcript
Using Evapotranspiration Datain Idaho Anthony Morse, William J. KramberIdaho Department of Water ResourcesBoise, Idaho Richard G. AllenUniversity of IdahoKimberly, Idaho
METRIC Mapping EvapoTranspiration with high Resolution and Internalized Calibration
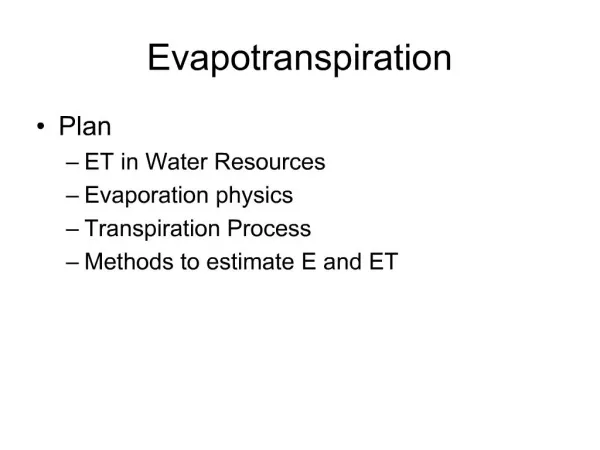
OUTLINE How METRIC Works IDWR METRIC Applications
METRIC SEBAL Trademark Issues with “SEBAL” SEBAL Commercially Available METRIC Uses Agrimet METRIC Tied to Reference ET
HOW METRIC WORKS Requires Satellites with Red, Near IR, and Thermal IR Complete Energy Balance for Each Pixel ET = Rn - G - H Rn H ET G
HOW METRIC WORKS Water vapor from soil and vegetation 24-hour ET from “instantaneous” overpass METRIC used for Landsat overpass dates, andPenman-Monteith equation between overpasses Use of hot and cold pixels for calibration. Seasonal
HOW METRIC WORKS ET from soil as well as vegetation Not Vegetation Index driven. 24-hour ET June 6, 2000 Landsat FCC June 6, 2000 .
METRIC 24 HOUR ET ETrF = ET / ETr ETrF at 11am (ETr is ET for alfalfa) 24-Hour ET Computation ET24 = (ETrF11am) (24-hour ETr)
METRIC CALIBRATION calibration is internal setting hot and cold pixels cold pixel hot pixel Maximum Frequency ET 0 Relative Temperature – Landsat Thermal Band absolute temperature is not needed
ET APPLICATIONS AT IDWR • Aquifer depletion • Water rights buy-back • Planning: ET by land use class • Water use by irrigated agriculture • Water rights compliance monitoring • Modeling: ET for computing water budgets • Analysis of water-rights curtailment alternatives.
AQUIFER DEPLETION METRIC Advantages time: 2 weeks vs. 6-8 months cost: ~$119 per well vs. ~$25 per well accuracy: pumpage vs. ET
WATER RIGHTS BUY-BACK 1079mmAlfalfa Nampa Agrimet 984 mm METRIC 1079 mmK-Factor 1240 mmPower Consumption Curve 1341 mmPump Performance Curve 1034 mmAlfalfaGrand View Agrimet
ET BY LAND USE CLASS How Does Water Use Change as Land Use Changes? ET By Land Use / Land Cover Land Use / Land Cover ET From METRIC
Class Name ET in mm Petroleum Tank Farm 237 Rangeland 242 Unclassified 298 Barren 335 Commercial / Industrial 380 Transportation 420 Idle Agriculture 436 Abandoned Agriculture 459 Junk Yard 467 Feedlot 479 Dairy 524 Other Agriculture 536 Public 548 Sewage Treatment 552 New Subdivision 606 Farmstead 609 Rural Residential 657 Urban Residential 684 Canal 731 Irrigated Crops 812 Perennial 820 Recreation 826 Water 924 Wetland 1,025 ET BY LAND USE CLASS Seasonal ET 3/15/2000 to 10/15/2000
AGRICULTURAL WATER USE RESULTS 2000 9,313,505 1,437,520 790 - 1021 Alfalfa (.77) IDWR/METRIC 2002 -- 1,176,516 -- Census of Agriculture 2000 -- 1,367,859 -- USGS 1997 -- 1,241,522 -- Census of Agriculture 1995 4,396,707 1,097,225490(807 Alfalfa)(.61)USGS 1992 -- 1,169,710 -- Census of Agriculture 1990 6,817,9911,235,348670(957 Alfalfa) (.70)USGS/IDWR 1987 -- 1,146,018 -- Census of Agriculture
WATER RIGHTS COMPLIANCE Irrigation Without a Water Right
WATER RIGHTS COMPLIANCE irrigation “in excess of the diversion rate of flow” 2. Use 2 consecutive Landsat overpasses (17 Days) 3. Compute 17-day cumulative ET (ET17) 4. Compute water depth using 17-day maximum diversion rate (DR17) 5. If ET17 > DR17, investigate. Method 1. Select 426 well-field combinations
WATER RIGHTS COMPLIANCE 18 Fields Exceeded Rate Limits 15 of 18 Due to Water Right File Issues 3 Valid Positives.
WATER BUDGETS Recharge = Diversion + Precipitation - ET Benefits: Increased Accuracy Lower Cost
METRIC BENEFITS TO IDWR More accurate ET data New Information on water use Less expensive, faster monitoring.
THE FUTURE… Landsat 5: limping badly 18 years past design life Landsat 7: scan-line corrector broken Landsat follow-on: LDCM: 2011 launch; no thermal yet.
FINAL THOUGHTS • Thermal data are critically important for water resources applications, and need to be included on future Landsats. 2. Status of thermal for Landsat 8 (LDCM)
INFORMATION www.idwr.idaho.gov/gisdata www.kimberly.uidaho.edu/water/metric/ The Boise River