Download
1 / 53
540 likes | 750 Vues
Boosted Decision Trees, a Powerful Event Classifier. Byron Roe, Haijun Yang, Ji Zhu University of Michigan. Outline . What is Boosting? Comparisons of ANN and Boosting for the MiniBooNE experiment Comparisons of Boosting and Other Classifiers

E N D
Boosted Decision Trees, a Powerful Event Classifier Byron Roe, Haijun Yang, Ji Zhu University of Michigan
Outline • What is Boosting? • Comparisons of ANN and Boosting for the MiniBooNE experiment • Comparisons of Boosting and Other Classifiers • Some tested modifications to Boosting and miscellaneous
Training and Testing Events • Both ANN and boosting algorithms use a set of known events to train the algorithm. • It would be biased to use the same set to estimate the accuracy of the selection; the algorithm has been trained for this specific sample. • A new set, the testing set of events, is used to test the algorithm. • All results quoted here are for the testing set.
Boosted Decision Trees • What is a decision tree? • What is “boosting the decision trees”? • Two algorithms for boosting.
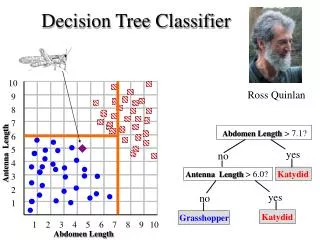
Decision Tree Background/Signal • Go through all PID variables and find best variable and value to split events. • For each of the two subsets repeat the process • Proceeding in this way a tree is built. • Ending nodes are called leaves.
Select Signal and Background Leaves • Assume an equal weight of signal and background training events. • If more than ½ of the weight of a leaf corresponds to signal, it is a signal leaf; otherwise it is a background leaf. • Signal events on a background leaf or background events on a signal leaf are misclassified.
Criterion for “Best” Split • Purity, P, is the fraction of the weight of a leaf due to signal events. • Gini: Note that gini is 0 for all signal or all background. • The criterion is to minimize gini_left + gini_right of the two children from a parent node
Criterion for Next Branch to Split • Pick the branch to maximize the change in gini. Criterion = giniparent – giniright-child –ginileft-child
Decision Trees • This is a decision tree • They have been known for some time, but often are unstable; a small change in the training sample can produce a large difference.
Boosting the Decision Tree • Give the training events misclassified under this procedure a higher weight. • Continuing build perhaps 1000 trees and do a weighted average of the results (1 if signal leaf, -1 if background leaf).
Two Commonly used Algorithms for changing weights • 1. AdaBoost • 2. Epsilon boost (shrinkage)
Definitions • Xi= set of particle ID variables for event i • Yi= 1 if event i is signal, -1 if background • Tm(xi) = 1 if event i lands on a signal leaf of tree m and -1 if the event lands on a background leaf.
AdaBoost • Define err_m = weight wrong/total weight Increase weight for misidentified events
Scoring events with AdaBoost • Renormalize weights • Score by summing over trees
Epsilon Boost (shrinkage) • After tree m, change weight of misclassified events, typical ~0.01 (0.03). For misclassfied events: • Renormalize weights • Score by summing over trees
Comparison of methods • Epsilon boost changes weights a little at a time • Let y=1 for signal, -1 for bkrd, F=score summed over trees • AdaBoost can be shown to try to optimize each change of weights. exp(-yF) is minimized; • The optimum value is F=½ log odds probability that Y is 1 given x
40’ D tank, mineral oil, surrounded by about 1280 photomultipliers. Both Cher. and scintillation light. Geometrical shape and timing distinguishes events
Tests of Boosting Parameters • 45 Leaves seemed to work well for our application • 1000 Trees was sufficient (or over-sufficient). • AdaBoost with beta about 0.5 and epsilonBoost with epsilon about 0.03 worked well, although small changes made little difference. • For other applications these numbers may need adjustment • For MiniBooNE need around 100 variables for best results. Too many variables degrades performance. • Relative ratio = const.*(fraction bkrd kept)/ (fraction signal kept). Smaller is better!
Effects of Number of Leaves and Number of Trees Smaller is better! R = c X frac. sig/frac. bkrd.
Number of feature variables in boosting • In recent trials we have used 182 variables. Boosting worked well. • However, by looking at the frequency with which each variable was used as a splitting variable, it was possible to reduce the number to 86 without loss of sensitivity. Several methods for choosing variables were tried, but this worked as well as any • After using the frequency of use as a splitting variable, some further improvement may be obtained by looking at the correlations between variables.
Comparison of Boosting and ANN • Relative ratio here is ANN bkrd kept/Boosting bkrd kept. Greater than one implies boosting wins! • A. All types of background events. Red is 21 and black is 52 training var. • B. Bkrd is pi0 events. Red is 22 and black is 52 training variables Percent nue CCQE kept
Numerical Results from sfitter (a second reconstruction program) • Extensive attempt to find best variables for ANN and for boosting starting from about 3000 candidates • Train against pi0 and related backgrounds—22 ANN variables and 50 boosting variables • For the region near 50% of signal kept, the ratio of ANN to boosting background was about 1.2
Robustness • For either boosting or ANN, it is important to know how robust the method is, i.e. will small changes in the model produce large changes in output. • In MiniBooNE this is handled by generating many sets of events with parameters varied by about 1 sigma and checking on the differences. This is not complete, but, so far, the selections look quite robust for boosting.
How did the sensitivities change with a new optical model? • In Nov. 04, a new, much changed optical model of the detector was introduced for making MC events • Both rfitter and sfitter needed to be changed to optimize fits for this model • Using the SAME feature variables as for the old model: • For both rfitter and sfitter, the boosting results were about the same. • For sfitter, the ANN results became about a factor of 2 worse
For ANN • For ANN one needs to set temperature, hidden layer size, learning rate… There are lots of parameters to tune. • For ANN if one a. Multiplies a variable by a constant, var(17) 2.var(17) b. Switches two variables var(17)var(18) c. Puts a variable in twice The result is very likely to change.
For Boosting • Only a few parameters and once set have been stable for all calculations within our experiment. • Let y=f(x) such that if x1>x2 then y1>y2, then the results are identical as it only depends on the ordering of values. • Putting variables in twice or changing the order of variables has no effect.
Tests of Boosting Variants • None clearly better than AdaBoost or EpsilonBoost
Can Convergence Speed be Improved? • Removing correlations between variables helps. • Random Forest (using random fraction[1/2] of training events per tree with replacement and random fraction of PID variables per node (all PID var. used for test here) WHEN combined with boosting. • Softening the step function scoring: y=(2*purity-1); score = sign(y)*sqrt(|y|).
Performance of AdaBoost with Step Function and Smooth Function
Post-Fitting • Post-Fitting is an attempt to reweight the trees when summing tree scores after all the trees are made • Two attempts produced only a very modest (few %), if any, gain.
Conclusions • Boosting is very robust. Given a sufficient number of leaves and trees AdaBoost or EpsilonBoost reaches an optimum level, which is not bettered by any variant tried. • Boosting was better than ANN in our tests by 1.2-1.8. • There are ways (such as the smooth scoring function) to increase convergence speed in some cases. • Post-fitting makes only a small improvement. • Several techniques can be used for weeding variables. Examining the frequency with which a given variable is used works reasonably well. • Downloads in FORTRAN or C++ available at: http://www.gallatin.physics.lsa.umich.edu/~roe/
References • R.E. Schapire ``The strength of weak learnability.’’ Machine Learning5 (2), 197-227 (1990). First suggested the boosting approach for 3 trees taking a majority vote • Y. Freund, ``Boosting a weak learning algorithm by majority’’, Information and Computation 121 (2), 256-285 (1995) Introduced using many trees • Y. Freund and R.E. Schapire, ``Experiments with an new boosting algorithm, Machine Learning: Proceedings of the Thirteenth International Conference, Morgan Kauffman, SanFrancisco, pp.148-156 (1996). Introduced AdaBoost • J. Friedman, T. Hastie, and R. Tibshirani, ``Additive logistic regression: a statistical view of boosting’’, Annals of Statistics 28 (2), 337-407 (2000). Showed that AdaBoost could be looked at as successive approximations to a maximum likelihood solution. • T. Hastie, R. Tibshirani, and J. Friedman, ``The Elements of Statistical Learning’’ Springer (2001). Good reference for decision trees and boosting. • B.P. Roe et. al., “Boosted decision trees as an alternative to artificial neural networks for particle identification”, NIM A543, pp. 577-584 (2005). • Hai-Jun Yang, Byron P. Roe, and Ji Zhu, “Studies of Boosted Decision Trees for MiniBooNE Particle Identification”, Physics/0508045, submitted to NIM, July 2005.
Example • AdaBoost: Suppose the weighted error rate is 40%, i.e., err=0.4 and beta = 1/2 • Then alpha = (1/2)ln((1-.4)/.4)= .203 • Weight of a misclassified event is multiplied by exp(0.203)=1.225 • Epsilon boost: The weight of wrong events is increased by exp(2X.01) = 1.02
Comparison of 21 (or 22) vs 52 variables for Boosting • Vertical axis is the ratio of bkrd kept for 21(22) var./that kept for 52 var., both for boosting • Red is if training sample is cocktail and black is if training sample is pi0 • Error bars are MC statistical errors only Ratio
Artificial Neural Networks • Use to classify events, for example into “signal” and “noise/background”. • Suppose you have a set of “feature variables”, obtained from the kinematic variables of the event
Neural Network Structure Combine the features in a non-linear way to a “hidden layer” and then to a “final layer” Use a training set to find the best wikto distinguish signal and background
Determining the weights • Suppose want signal events to give output =1 and background events to give output=0 • Mean square error given Np training events with desired outputs oi either 0 or 1, and ANN results ti.