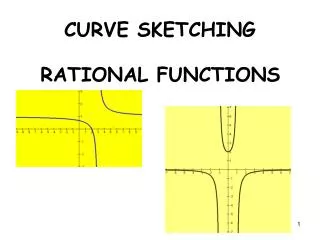
Rational Functions
An introduction. Rational Functions. L. Waihman. A function is CONTINUOUS if you can draw the graph without lifting your pencil. A POINT OF DISCONTINUITY occurs when there is a break in the graph. Note the break in the graph when x=3. Why?. Look at the equation of the graph.


Rational Functions
E N D
Presentation Transcript
An introduction Rational Functions L. Waihman
A function is CONTINUOUS if you can draw the graph without lifting your pencil. A POINT OF DISCONTINUITY occurs when there is a break in the graph. Note the break in the graph when x=3. Why?
Look at the equation of the graph. Where is this equation undefined? We can factor the numerator and reduce the fraction to determine that the graph will be a line; however, the undefined point remains, so there is a point of discontinuity here.
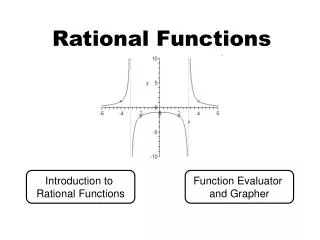
A rational function is the quotient of at least two polynomials. The graphs of rational functions frequently display infinite and point discontinuities. Rational functions have vertical asymptotes and may have horizontal asymptotes as well.
Let’s look at the parent function: If x = 0, then the entire function is undefined. Thus, there is a vertical asymptote at x=0. Looking at the graph, you can see that the value of the function , as the values of x 0 from the positive side; and the value of the function - , as the values of x 0 from the negative side. These are the limits of the function and are written as:
Domain • The domain is then limited to: • To find the domain of a rational function, • set the denominator equal to zero. • The denominator will always be all real • numbers except those values found by • solving this equation.
Determine the domain of these rational functions:
Recall that a vertical asymptote occurs when there is a value for which the function is undefined. This means, if there are no common factors, anywhere the denominator equals zero. Since a rational function is a quotient of two, polynomials, there will always be at least one value for which the entire function is undefined.
Remember that asymptotes are lines. When you label a vertical asymptote, you must write the equation of the vertical line. Just make x equal everything it couldn’t in the domain. State the vertical asymptotes:
But why isn’t this the same as our discontinuities? Because discontinuities occur EVERYWHERE the function is undefined VA’s exist ONLY where a factor of the numerator and denominator DO NOT cancel each other
BOBO: If n<m, then is a horizontal asymptote. • If the exponent is Bigger On Bottom, the HA is y = 0 • BOTN: If n>m, then there is NO horizontal asymptote. • If the exponent is Bigger On Top, there is NO HA • EATS DC: If n=m, then is a horizontal asymptote, where c is the quotient of the leading coefficients. • Exponents Are The Same – Divide the Coefficients Given: is a polynomial of degree n , is a polynomial of degree m , and , 3 possible conditions determine a horizontal asymptote:
One final type of asymptote The Slant Asymptote ONLY occurs when the NUMERATOR is one degree higher than the DENOMINATOR
Graph: Notice that in this function, the degree of the numerator is larger than the denominator. Thus n>m and there is no horizontal asymptote. However, if n is one more than m, the rational function will have a slant asymptote. To find the slant asymptote, divide the numerator by the denominator: The result is . Notice that as the values of x increase, the fractional part decreases (goes to 0), so the function approaches the line . Thus the line is a slant asymptote.
To graph a function, then 1st, find the vertical asymptote(s). (Where is the function undefined? Set denom. = 0) 2nd , find the x-intercept (s). (Set the numerator = 0 and solve) 3rd , find the y-intercept(s) . (Set x = 0 and solve) 4th , find the horizontal asymptote. (BOBO, BOTN, or EATS DC) 5th , find the slant asymptote. (Is the numerator ONE degree higher than the denominator? Divide.) 6th , sketch the graph.
Suppose that you were asked to graph: 1st, determine where the graph is undefined. (Set the denominator to zero and solve for the variable.) There is a vertical asymptote here. Draw a dotted line at: 2nd , find the x-intercept by setting the numerator = to 0 and solving for the variable. So, the graph crosses the x-axis at Draw a dotted line at:
3rd , find the y-intercept by letting x=0 and solving for y. So, the graph crosses the y-axis at 4th , find the horizontal asymptote. (Recall the test; , so .) Thus, . The horizontal asymptote is:
Graph: 1st, find the vertical asymptote. 2nd , find the x-intercept . 3rd , find the y-intercept. 4th , find the horizontal asymptote. 5th , sketch the graph.
1st, factor the entire equation: Graph: Then find the vertical asymptotes: 2nd , find the x-intercepts: 3rd , find the y-intercept: 4th , find the horizontal asymptote: 5th , sketch the graph.
Graph: Notice that in this function, the degree of the numerator is larger than the denominator. Thus n>m and there is no horizontal asymptote. However, if n is one more than m, the rational function will have a slant asymptote. To find the slant asymptote, divide the numerator by the denominator: The result is . Notice that as the values of x increase, the fractional part decreases (goes to 0), so the function approaches the line . Thus the line is a slant asymptote.
Graph: 1st, find the vertical asymptote. 2nd , find the x-intercepts: and 3rd , find the y-intercept: 4th , find the horizontal asymptote. none 5th , find the slant asymptote: 6th , sketch the graph.