Trip Generation CE 451/551
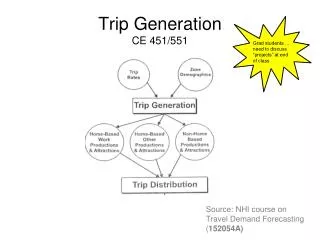
Trip Generation CE 451/551. Grad students … need to discuss “projects” at end of class. Source: NHI course on Travel Demand Forecasting ( 152054A). Terminology. Trip generation Person trip Vehicle trip Trip end Trip production Trip attraction Trip purposes Home-based work (HBW) trip

Trip Generation CE 451/551
E N D
Presentation Transcript
Trip GenerationCE 451/551 Grad students … need to discuss “projects” at end of class Source: NHI course on Travel Demand Forecasting (152054A)
Terminology • Trip generation • Person trip • Vehicle trip • Trip end • Trip production • Trip attraction • Trip purposes • Home-based work (HBW) trip • Non-home based (NHB) trip … others • Special generator • Socioeconomic data • Demographic data Image: http://www.angryspec.com/scrounge.htm
Trip purposes Practice has shown that better travel forecasting models are obtained if trips by different purposes are identified and modeled separately. The most common trip purposes are: • HBW • HBO • NHB In TDF, trip productions and attractions are used to represent the ends of a trip. A production is the home end of an HB trip and the beginning of a NHB trip. HB trips (urban) constitute ~70% of all trips Others?
Trips, by purpose (the objective) PA Table
Typical Trip Generation Process Demographic and Socioeconomic inputs Cross Classification Model Trip Productions by zone, by purpose Employment, attraction landuse data Balance (system-wide) Regression model PA Tables, by purpose Trip Attractions by zone, by purpose
Balancing attractions to productions Rule of thumb: original estimates of total production and attractions should be within 10% of each other.
What is trip generation a function of? • Land use • Intensity • Location/accessibility • Time • Type (person, transit, auto, walking …) Photo by en:User:Aude, taken on March 7, 2006 Graphic source: http://www4.uwm.edu/cuts/utp/routeloc.pdf
Trip Generation • Determine number of “trip ends” • Methods • Regression • Cross Classification (tables) • Rates based on activity units (ITE) Image: www.caliper.com
aggregation hides variability Regression “Estimating” a model • Y = f(X) • Aggregate (zonal) or disaggregate (household) • Linear or nonlinear • Dependent (Y) variable is trips • Independent (Xi) variables are … • Household attributes • E.g., population, auto ownership, income level • Employment attributes • E.g., number of employees or size of establishments • Could include network attributes? • Be careful of … co-linearity, power • Can use your own data (best?) or borrow parameters
http://xkcd.com/503/This work is licensed under a Creative Commons Attribution-NonCommercial 2.5 License. This means you're free to copy and share these comics (but not to sell them). More details
Breaks the trip generation process into steps Relies on aggregate data collected from surveys (like Census), like average income by income categories auto ownership Trip rate/auto Trip purpose % Resembles regression, but non-parametric (like regression with dummy variables) Groups households in different strata 1-4+ submodels (table based) Improved by adding info Advantages No prior info on shape of curves must be assumed Simple, easy to understand Can be used to account for time, space Disadvantages Does not permit extrapolation No goodness of fit measures Requires large sample size See wiki on Contingency tables Cross classification models From: Amarillo 1990 model docs, ITE
One step Cross classification model (productions) HBW 2007 eq.* 0-$8000 $8K-$16K $16K-$32K $32K-$56K $56K plus * Note: US avg. median HH income = $30K in 1990 … is now $50,000 (2007) From: Amarillo 1990 model
One step Cross classification model (productions) NHB 2007 eq. 0-$8000 $8K-$16K $16K-$32K $32K-$56K $56K plus From: Amarillo 1990 model
Multi-step Cross Classification ExampleSource: ITE (Univ. of Idaho)
First … Develop the family of cross class curves and find number of households in each income group 00 Given (from survey) Note: orange lines show how to develop the curves M H L L
Now find … percent of households in each auto ownership/income group “class” …
L M H A Given (from survey) 15K 25K 55K
Now find … trips per households in each auto ownership/income group “class” …
L M H Given (from survey) B
L M H Given (from survey) C
Recall the problem … For the zone … multiply the number of households in each income group (00) by the percent of households owning certain number of cars by income group (A) to get the total number of households by auto ownership in each income group (00 x A) …see next slide series Multiply the result (00xA) by the number of trips generated by each income group/auto ownership category (B) to get trips by income group/auto ownership category (00xAxB). Sum to get trips by income level (∑(00xAxB)). Multiply this sum by the percent of trips by purpose (C) to get trips by purpose by income group (Cx∑(00xAxB)). Sum over all income groups to get (total trips by purpose from the zone). ANS
00 A Low x Med High = 00xA B = x
00xAxB C x Cx∑(00xAxB) =
Cross classification model (attractions) Note: Less data than for productions, can use cross-class or regression, most common classification is by type of employment 1998 Austin, TX household travel survey
Experience Based Analysis See also Wisconsin Trip Rate Files(Madison has annotation) Click in slideshow mode
Typical trip gen application • Traffic engineers use rates (e.g. ITE), why? (data, peak) • Planners use cross class and regression, why? (purpose, forecasting) • Can we use rates in the TDF? How? • http://www.ite.org/tripgen/Trip_Generation_Data_Form.pdf
Special generators • Shopping malls (large) • Hospitals (different) • Military institutions • Airports (large) • Colleges and universities (large, different) • Stadiums (off peak) • Elderly housing (small) Click in slideshow mode