Trachea (Generation #1)
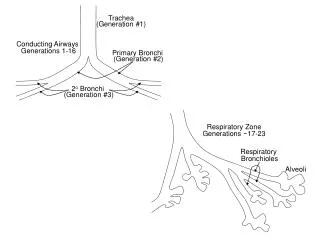
Trachea (Generation #1). Conducting Airways Generations 1-16. Primary Bronchi (Generation #2). 2 o Bronchi (Generation #3). Respiratory Zone Generations ~17-23. Respiratory Bronchioles. Alveoli. P B =0. Zone 1 P A >P a >P v Low Flow. P A. P a. P v. Flow= P /R. Zone 2

Trachea (Generation #1)
E N D
Presentation Transcript
Trachea (Generation #1) Conducting Airways Generations 1-16 Primary Bronchi (Generation #2) 2o Bronchi (Generation #3) Respiratory Zone Generations ~17-23 Respiratory Bronchioles Alveoli
PB=0 Zone 1 PA>Pa>Pv Low Flow PA Pa Pv Flow=P/R Zone 2 Pa>PA>Pv Waterfall PA Pa Pv PA<0 Zone 3 Pa>Pv>PA Hi Flow PA O2 venous arterial Pa Pv CO2
Atmospheric Air High O2 (150 mmHg) CO2 ~ 0 PB=0 PB=0 Inspiration Expiration Alveolar Air O2 ~100 mmHg PA<0 PA>0 CO2 ~ 40 mmHg O2 O2 venous arterial venous arterial CO2 CO2
Lung Air leak Pneumothorax Lung collapses & Chest expands Chest Wall Lung Stuck Together Fick’s law J = DA (C/ X)
Inspiratory Reserve Inspiratory Capacity Vital Capacity VT Expiratory Reserve FRC Residual Volume Total Lung Capacity
Inspiratory Reserve Inspiratory Capacity IR IC Vital Capacity VC Total Lung Capacity TLC VT VT Expiratory Reserve ER FRC FRC Residual Volume RV RV
C1V1= C2(V1 +VL) V1 Equilibrate Concentration V1 C1V1=N C2(V1 +VL)=N VL VL VL=(C1/C2)V1 –V1
Inspiratory Reserve Inspiratory Capacity Vital Capacity 5 L ~6.5 L Total Lung Capacity VT 600 ml Expiratory Reserve FRC 2.5 L Residual Volume 1.2 L
Chest Wall Lung Lung Stuck Together As we remove air from pleural space the lung expands & the chest wall gets pulled in.
Balance of Forces Determines FRC Hooke’s Law: F = -kx Chest Wall Recoil Force Increasing volume Intrapleural space Ppl = -2 Normal FRC Ppl = -5 Ppl= -8 Lung Wall Recoil Force Decreasing volume Ppl = 0 Emphysema lung recoil Fibrosis lung recoil Pneumo- thorax Normal
LaPlace 2T=Pr P=2T/r P2 P1 For same T, P1>P2 (I.e. 2T/r1 >2T/r2)
Surface Area Surface Tension Lung Surfactant Plasma Surfactant 40% Dipalmitoyl Lecithin 25% Unsaturated Lecithins 8% Cholesterol 27% Apoproteins, other phospholipids, glycerides, fatty acids Surface Area (relative) Detergent Water 30 60 80 Surface Tension (dynes/cm)
Surface Area Surface Tension Lung Surfactant • Reduces Work of Breathing • Increases Alveolar Stability (different sizes coexist) • Keeps Alveoli Dry Surface Area (relative) Detergent Water 30 60 80 Surface Tension (dynes/cm)
Static Compliance Curves Expiration Inspiration
Ppl = -2 Ppl= -8 Ppl = 0 Emphysema lung recoil Fibrosis lung recoil Pneumo- thorax Balance of Forces Determines FRC Hooke’s Law: F = -kx Chest Wall Recoil Force Increasing volume Intrapleural space Normal FRC Ppl = -5 Lung Wall Recoil Force Decreasing volume Normal
Chest Wall Apex -8 -5 Lung has weight Ppl = -2 Base
Respiratory Cycle Ppl time VT (L) 0.4 Respiratory Cycle Single VT Breath -5 Rest FRC 0.2 0 Air Flow -8 Inspiration Inspiration Expiration 0 - Ppl (cmH2O) -5 End Inspiration PB=0 -8 PA= 0 Expiration + -6 -8 +0.5 End Expi- ration-FRC 0 -5 Air Flow (L/s) 0 The linear Dashed trace is the Ppl required to overcome recoil forces. More Ppl (solid curve) is required to overcome airway resistance to flow. N.B. P = PA-PB Resist•Flow. -0.5 +1 PA (cm H2O) 0 -1 1 2 3 4 time (sec)
Static Compliance Curves Expiration Inspiration
Respiratory Cycle Ppl time VT (L) 0.4 Respiratory Cycle Single VT Breath -5 Rest FRC 0.2 0 Air Flow -8 Inspiration Inspiration Expiration 0 - Ppl (cmH2O) -5 End Inspiration PB=0 -8 PA= 0 Expiration + -6 -8 +0.5 End Expi- ration-FRC 0 -5 Air Flow (L/s) Case of ZERO Resistance 0 -0.5 +1 PA (cm H2O) 0 -1 1 2 3 4 time (sec)
Respiratory Cycle Ppl time VT (L) 0.4 Respiratory Cycle Single VT Breath -5 Rest FRC 0.2 0 Air Flow -8 Inspiration Inspiration Expiration 0 - Ppl (cmH2O) -5 End Inspiration PB=0 -8 PA= 0 Expiration + -6 -8 +0.5 End Expi- ration-FRC 0 -5 Air Flow (L/s) 0 The linear Dashed trace is the Ppl required to overcome recoil forces. More Ppl (solid curve) is required to overcome airway resistance to flow. N.B. P = PA-PB Resist•Flow. -0.5 +1 PA (cm H2O) 0 -1 1 2 3 4 time (sec)
Respiratory Cycle Ppl time VT (L) 0.4 Respiratory Cycle Single VT Breath -5 Rest FRC 0.2 0 Air Flow -8 Inspiration Inspiration Expiration 0 - Ppl (cmH2O) -5 End Inspiration PB=0 -8 PA= 0 Expiration + -6 -8 +0.5 End Expi- ration-FRC 0 -5 Air Flow (L/s) Case of HIGH Resistance 0 -0.5 +1 PA (cm H2O) 0 -1 1 2 3 4 time (sec)
Dynamic Compression of Airways Mild Expiratory Effort (P+13) Normal at FRC -5 0 0 PTP=+5 PPl - PA= -5
Mild Expiratory Effort (P+13) Strong Expiratory Effort (P+30) +13 Normal Normal at FRC - 5 +8 +25 +13 0 +13 8 4 0 30 25 20 15 10 5 0 PTP=+5 PPl - PA= -5 EPP EPP Equal Pressure Point (in supported airways) Emphysema Emphysema +28 - 2 +11 0 13 10 8 6 4 2 0 30 25 20 15 10 5 0 P - P = - 2 Pl A EPP EPP in unsupported airways Dynamic Compression of Airways Low VL& Basal Alv also like this
v = Flow/A NR= Dv/ =density D= diameter v= velocity = viscosity Subsegmental Bronchi Resistance 8l R= ——— r4 Resistance Total Cross Sectional Area Conducting Zone Resp Zone k•number R= ————— A2 5 1 0 15 5 1 0 15 Airway Generation Airway Generation
¯ Recoil Airway Resistance Emphysema Normal Fibrosis Lung Volume
Normal Inspiration Volume Recoil Restrictive Resistance Obstructive FRC time (sec)
Obstructive airway resist Restrictive lung recoil TLC TLC FEV1.0 FEV1.0 FVC FVC RV RV 1 sec 1 sec FEV1.0 = 1.2 L FVC = 3.0 L % = 40% FEV1.0 = 2.7 L FVC = 3.0 L % = 90% Forced Vital Capacity Normal TLC FEV1.0 FVC RV 1 sec FEV1.0 = 4 L FVC = 5 L % = 80%
Flow-Volume Curves Effort Independent limb in forced expiration. Expiratory Flow Due to Dynamic Airway Compression and airway collapse. TLC RV Lung Volume
Forced expiration Expiratory Flow Inverted Inspiration TLC RV Lung Volume Inspiratory Flow Inspiration
9 Normal Obstructive Flow Rate (L/sec) Restrictive 9 8 7 6 5 4 3 2 1 Lung Volume (L)
Critical Closing Volume Test TLC RV 4. 40 1. 3. Alveolar Plateau 2. Dead Space Washout N2 Concentration (%) 20 Closing Volume 6 5 4 3 2 1 Lung Volume (L)
Increased Closing Volume Critical Closing Volume Test TLC RV 4. 40 1. 3. Alveolar Plateau 2. Dead Space Washout N2 Concentration (%) 20 Closing Volume 6 5 4 3 2 1 Lung Volume (L)
PO2=100 mm Hg 21 ml O2/dL PO2=100 mm Hg 21 ml O2/dL O2 O2 PO2=100 mm Hg 0.3 ml O2/dL PO2=100 mm Hg 0.3 ml O2/dL dissolved20 ml O2/dL HB-O2 O2 O2
40 Alveolar Plateau Inspired O2 diluted by alveolar N2 A N2 Concentration (%) 20 Vd Fowler’s Test Area A = Area B B 0 0.2 0. 4 0.6 0.8 Expired Lung Volume (L)
The Bohr Equation VD1 (PACO2 – PECO2) = VT PACO2 VD2 (PaCO2 – PECO2) = VT PaCO2 D. Sample Calculation VT = 600 ml PACO2 = 38 mmHg PECO2 = 28 mmHg PaCO2 = 40 mmHg VD1 = 600(38 – 28)/38 = 158 ml VD2 = 600(40 – 28)/40 = 180 ml E.Alveolar Ventilation . . . VE = VD + VA = VT frequency . . . VA = VE - VD .1.For VT = 500 ml, f = 10/min, VD = 150 ml, what is VA? .VA = 5000 - 1500 = 3500 ml/min . .2.If VE is doubled by increasing VT what is VA? = 10,000 - 1500 = 8500 ml/min . .3.If the same VE is obtained by doubling frequency, what is VA? = 10,000 - 3000 = 7000 ml/min .Thus increasing VT rather than frequency is more effective for VE.
F. Alveolar Ventilation and CO2 production . VCO2 = Expired CO2 - Inspired CO2 . =VA FACO2 . VA x PACO2 = PA ..VCO2 K VA = PACO2
XIV. RESPIRATORY GAS CASCADE PO2 PCO2 mm Hg mm Hg Air (dry) 760 0.21 160 0 Trachea (humidified; 760-47) 713 0.21 150 0 Alveolus (some O2 absorbed by blood) 100 40 Arterial (R-L Shunt) 90 40+ Mixed venous (O2 absorbed by tissues) 40 46
O2 Diffusion in Pulmonary Capillaries (transit time) 100 Thickened Alveolar Membrane 80 60 PO2 mm Hg Normal Transit Time 40 Exercise Shortens Transit time 20 0.75 0.25 0.5 time in Capillary (sec)
Tissue CO2 Loading & O2 Unloading CO2 O2 Capillary Wall Cl- O2 CO2 c.a. CO2 + H2O — H2CO3 H+ + HCO3- H+ + HbO2 HHb + O2 Carbamino HHb-CO2