Download
1 / 29
320 likes | 1.04k Vues
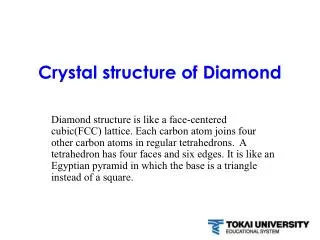
Crystal growth and characterization of HPHT diamond from a phosphorus-carbon system. Yu.Pal ’ yanov *, I.Kupriyanov , A.Khokhryakov , Yu.Borzdov , V.Gusev , J.V an Royen a , a a a b c

E N D
Crystal growth and characterization of HPHT diamond from aphosphorus-carbon system Yu.Pal’yanov *, I.Kupriyanov , A.Khokhryakov , Yu.Borzdov , V.Gusev , J.V an Royen a, a a a b c Institute of Mineralogy and Petrography, Siberian Branch of the Russian Academy of Sciences, Academician Koptyug Prospect, 3, a Novosibirsk 630090, Russia Institute of Automation and Electrometry SB RAS, Ac. Koptyug Prospect, 1, Novosibirsk 630090, Russia b Hoge Raad voor Diamant, GDI Department, Plaslaar 50, Lier 2500, Belgium c Received 27 March 2003; received in revised form 6 May 2003; accepted 12 May 2003
Abstract • Crystallization of diamond in the phosphorus-graphite system • At 7 GPa and 1750 ℃ with duration from 5 to 20 h. • Spontaneous diamonds crystallized both Film growth (FG) and temperature gradient growth (TGG). • For TGG diamonds faces of tetrahexahedron and trapezohedron indexed as {310} and {911}. • By FTIR measurement, bluish coloration characteristic from a continuum of absorption, which is similar to the phosphorus photo-ionization continuum seen in P-doped CVD diamond films.
1. Introduction • n-type semiconducting diamond using phosphorus as the dopant. • * Phosphorus impurity in CVD diamond * High pressure high temperature (HPHT) synthesis using phosphorus as a solvent-catalyst.(7.7 GPa and 1800 8C.) • Diamond layers grown on the seeds had some bluish coloration. • Phosphorus catalyst ; Spontaneously nucleated crystals were, however, black in color.
The major difficulty ; high pressures and Temperatures. • Spontaneous nucleation of diamond at the interface between the graphite carbon source and catalyst melt through the so-called film growth (FG) process.-> Alot of inclusions , irregular shape that makes their spectroscopic characterization hardly possible. • Spontaneous nucleation and synthesis of diamond can also be realized within the carbon-saturated catalyst melt through the temperature gradient growth (TGG) process.-> higher morphological perfection, contain few inclusions and may be of sizes sufficient for spectroscopic characterization to be made.
In the present work : P-doped HPHT diamonds suitable for the optical spectroscopy studies in the phosphorus-graphite system under conditions of 7 GPa and 1750 8C for 5.20 h. • By scanning electron microscopy and goniometry. • For a number of TGG diamonds it was possible to measure infra-red absorption and in addition measurements of visible cathodoluminescence were made.
2. Experimental • ‘Splitsphere’ type multi-anvil apparatus. • The starting materials : a graphite rod (99.99% purity) as the carbon source and crystallization ampoule material. Phosphorus powder (99.99% purity) as the solvent. • Phosphorus powder together with the seed crystals was pressed into a cylindrical sample and placed into the graphite ampoule. The ampoule was then embedded inside a high-pressure cell. • MgO sleeve was used to isolate the graphite ampoule from the heater. • 7 GPa and temperature of 1750 8C with holding time of 5, 10, 15 and 20 h.
Crystallization ampoules were first cracked and examined with a binocular microscope. • Then the products were dissolved in hot nitric acid. The recovered spontaneously nucleated diamonds and seed crystals were studied using optical microscopy and a LEO 420 scanning electron microscope (SEM). • Crystallographic indexes of the faces were determined for five spontaneous diamond crystals and two seed crystals by a GD-1 two-circle goniometer.
3. Results and discussion • At the conditions of 7 GPa and 1750 8C, holding time of 5 h through film growth (FG) process. • In the recovered sample octahedral and twinned diamond crystals of ca 10 mm in size were found at the interface between the graphite ampoule and phosphorus catalyst (Fig.1a ). 3.1. Diamond growth and crystal morphology
For 20 h the degree of the graphite-to diamond conversion was approximately 80%. The graphite ampoule almost completely turned to a polycrystal diamond aggregate. In this case, some crystals and twins were up to 300.400 mm in size. They had rough surfaces and were black and opaque (Fig.1 b).
TGG process with duration of 10 h and longer. The TGG diamonds, crystallized within the phosphorus melt and on the seed crystals, as a rule, did not contain inclusions, were transparent, and had gray to grayish blue color. In a 20-h run the crystals were up to 150 mm in size, some of these diamonds were selected for spectroscopic characterization described below.
The TGG crystals had a specific morphology, which is uncommon to diamond. Corners of the octahedrons were frequently truncated by four small faces of tetrahexahedron (Fig.2a ).
From the goniometric measurements it was established that the tetrahexahedral faces had the {310} crystallographic indexes. Edges between the {310} and {111} faces have [321] direction and form angles 80° and 140°. Sometimes edges between the {310} faces were truncated by microscopic trapezohedral faces (Fig.2 b).
The occurrence of faces other than octahedral in case of the TGG diamond crystals in contrast to the FG ones, which were bounded by only {111} faces, is probably due to the fact that the latter crystallized at the conditions of considerably higher carbon supersaturation and, consequently, with relatively higher growth rates. • In all experiments diamond growth on both the {100}and {111} faces of the seed crystals was established.
SEM micrograph of a seed crystal recovered from a 5-h run is presented in Fig.5a. In this case, the {100} faces exhibitnumerous regeneration pyramids of tetragonal shape, whereas the {111} faces are flat but many rounded depressions of a few microns in size are present.
Why? It has many rounded depressions??1. related to the presence of some kind of gas phase.2. heterogeneous structure of the melt. • Curious flat-bottomed depressions approximately 10.30 mm in size (Fig.5 b,c). The depressions had ditrigonal (pseudo-hexagonal) shape with the internal angles 80° and 140° and sharp corners directed to [211]. • Crystallographic point of view, correspond to tetrahexahedron faces. Growth layers on the cubic faces are characterized by a blocky structure with numerous depressions of irregular shape (Fig.5 b, right upper part of the crystal). Goniometric measurements made for the recovered seed crystals revealed the presence of the octahedral and{310} tetrahexahedral faces.
Note that from phosphorus catalyst peculiar growth steps with the direction indexed as <321> were observed on the grown surfaces. Although in the present work such growth steps were not found one could easily see that the observed ditrigonal depressions correspond to the patterns which the <321> steps may eventually form. • Now , taking into account the occurrence of the {310} faces and the fact that the <321>direction corresponds to the direction of the edges between the {310} and {111} faces could form due to development of the {310} faces.
The absorption : (b) lies near 800 meV, for spectrum (a) at photon energies greater than 650 meV the detector was saturated. Apparently, this continuous absorption extending to the visible part of the spectrum gives the samples characteristic bluish coloration. 3.2. Spectroscopic characterization
As it has been found previously phosphorus doped CVD diamondfilms show characteristic infrared absorption with a threshold of approximately 510 meV and maximum near 800 meV, which was assigned to the photo-ionization of phosphorus centers. • The absorption continuum, which coincides well with that reported for P-doped CVD diamonds and is most probably of the same origin, i.e. photo-ionization of phosphorus. • Further , more rigorous conclusion about phosphorus centers in HPHT diamonds can be made from the absorption measurements taken at low temperatures, which may reveal peaks due to the electronic transitions to the excited states of phosphorus.
However , in both cases the superimposed oscillating interference fringes hamper accurate identification of the bandshape. • Note that the one phonon absorption resembles somewhat the infra-red spectrum of single substitutional nitrogen, although sharp peaks seen in both spectra lie near 1332 cm¯1 (Raman frequency) rather than 1344 cm¯1 (local vibrational mode induced by single substitutional nitrogen). • Obviously, to clarify the nature of the one-phonon absorption in P-doped HPHT diamond, samples allowing for better infra-red spectra to be obtained are necessary.
Under electron-beam excitation all of the crystals examined exhibited bright luminescence whose intensity increased as the samples were cooled down. • No significant sample-dependent variations in the spectra and the representative ones recorded at room and liquid nitrogen Temp are presented in Fig.7
The spectra comprise of broad featureless bands peaking at 2.5 and 2.7 eV at room and LN temperatures. The luminescence bandshape and its temperature dependence suggest that there appears to be at least two emission systems.1. well-known blue band-A peaking at approximately 2.8 eV2. broad band with maximum shifted to the green part of the spectrum. • Also, note that the recorded CL spectra do not show bands due to the nitrogen-vacancy centers H3 and 2.156 eV, which are commonly observed in diamonds synthesized using non-metallic solvent-catalysts.
Phosphorus acting as a donor stabilize these defect through the charge compensation in their negatively charged states (H2 and 1.945 eV), which are known to be inactive in cathodoluminescence. • Unfortunately, due to instrumental limitations in this study we were not able to measure CL spectra in the ultraviolet region, where characteristic bound exciting emission peaks related to phosphorus may be observed.
4. Summary • 1. In the phosphorus-graphite system at 7 GPa and 1750 8℃ spontaneous nucleation of diamond took place first at the interface between graphite and phosphorus catalyst through the FG process, and then, with increasing holding time phosphorus melt got saturated with carbon and diamond crystallized within the catalyst melt through the TGG process.
2. The FG diamonds had octahedral morphology, black color and were of poor quality. Diamonds crystallized through the TGG process were transparent and had gray to grayish-blue color. Morphology of the TGG diamonds was determined by the faces of octahedron and {310} tetrahexahedron, sometimes, with additional faces of the {911} trapezohedron. Faces with the {310} and {911} crystallographic indexes are the new growth forms for synthetic diamond.
3. Infra-red absorption measurements for HPHT diamonds synthesized with phosphorus catalyst have been made for the first time. It was shown that bluish coloration of these diamonds arises from an absorption continuum, which is very similar to that found for phosphorus doped CVD diamonds and related to the photo-ionization of phosphorus centers.
The END • Don`t forget! 안되면 되게하라-!