PGMS
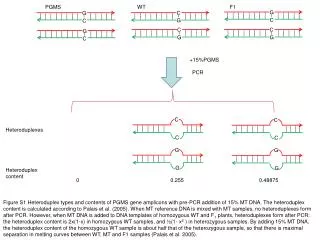
PGMS. WT. F1. C. C. C. G. G. G. G. G. G. C. C. C. +15%PGMS. PCR. C. C. Heteroduplexes. C. C. G. G. G. G. Heteroduplex content. 0. 0.255. 0.48875.

PGMS
E N D
Presentation Transcript
PGMS WT F1 C C C G G G G G G C C C +15%PGMS PCR C C Heteroduplexes C C G G G G Heteroduplex content 0 0.255 0.48875 Figure S1 Heteroduplex types and contents of PGMS gene amplicons with pre-PCR addition of 15% MT DNA. The heteroduplex content is calculated according to Palais et al. (2005). When MT reference DNA is mixed with MT samples, no heteroduplexes form after PCR. However, when MT DNA is added to DNA templates of homozygous WT and F1 plants, heteroduplexes form after PCR: the heteroduplex content is 2x(1-x) in homozygous WT samples, and ½(1- x2 ) in heterozygous samples. By adding 15% MT DNA, the heteroduplex content of the homozygous WT sample is about half that of the heterozygous sample, so that there is maximal separation in melting curves between WT, MT and F1 samples (Palais et al. 2005).
G NK-OLF a A NK-MF G NK-CR DNA and primer site G G PGMS WT G C amplicons WT G C PGMS A G G G b G RNZ-OLF A TA RNZ-MF RNZ-R TGMS DNA and primer site TA G TC/GC G WT amplicons TC/GC G WT TGMS TA A TA G Figure S2 A schematic representation of primers designed for CADMA analysis of the lncR (PGMS, a) and RNZ (TGMS, b) loci in rice.
a Figure S3 CADMA analysis of rice individual F2 plants. a: Genotyping of F2 plants of derived from cross of PGMS line DS550 and wild type line T23 at the lncR locus. DS550 and T23 are included as controls. b and c: Genotyping of the RNZ locus for F2 plants derived from crosses of TGMS line Zhu 1S and wild type lines 08EZ01 and Z10, respectively; parental lines are included as controls. d: combination of panels b and c; Red curves show the sterile plants and all others show the fertile plants. IIIP IP IIP b IIIT IT IIT c VT IT IVT d VT IIIT IT IIT IVT
a IIIP IP IIP b IIIT IT IIT Figure S4 Hybrid rice seed purity test by CADMA analysis. a: Genotyping of F1 hybrid seeds of DS550/T23 for the lncR locus, together with DS550 (one of the two IP lines) and T23 (IIP). b: Genotyping of F1 hybrid seeds of Guangzhan63S/9311 for the RNZ locus, along with Guangzhan63S (one of the 4 IT lines) and 9311 (one of the 4 IIT lines).