Download
1 / 19
190 likes | 290 Vues
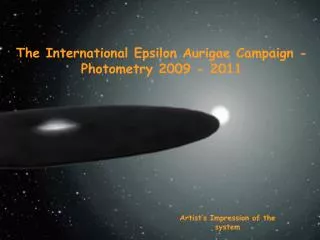
Engage in research project analyzing celestial spectra data to determine properties of disk structures. Utilize telescope equipment and IRAF software to measure wavelengths, widths, and velocities. Collaborate with experts to interpret results. Engage students in educational lessons on astronomy findings. Explore potential ring structures within the disk. Plan for future data collection and analysis to uncover further insights.

E N D
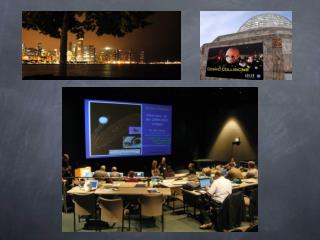
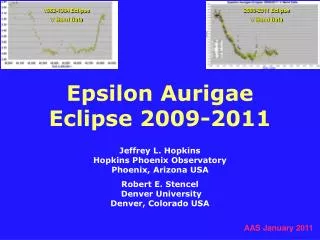
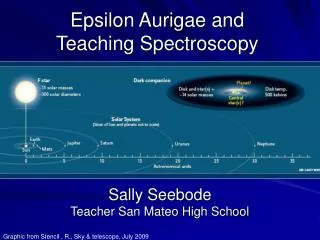
CSM Epsilon Aurigae Project Sally Seebode Science Educator SMUHSD
CSM Epsilon Aurigae Team • Dean Drumheller, Steve Howell, Don Hoard, Sally Seebode, Darryl Stanford
Research Project • Take data: CSM Telescope, work with Dean Drumheller • Reduce spectra: Use IRAF to turn observations into graph form • Make spectra measurements: wavelengths, peak widths, etc • Gather and organize data: Calculations, averages, make graphs • Interpret Results: Team meetings
Our Project • Take Data
Equipment Hardware: • Losmandy G11 Mount • Meade 8” SCT @f/6.3 • SBIG Self Guided Spectrograph (SGS) • ST7XME camera Software: • TheSky 6- accurate mount control • CCDSoft –image acquisition • Maxim DL –image acquisition • IRAF –spectra processing
Turn data into useful form Raw Data Frame Reduced Spectrum: standard methods using IRAF 3800 – 4600A; 5800 – 6600A
Make measurements • Equivalent • Width • Full Width Half • Max • Velocity Minimum three students make measurements for each spectra, data averaged and plotted.
Defining Measurements Equivalent Widths (eqw): the width of a standardized rectangle representing the area of the absorption line. EQW relates to the flux. Exaggerated for emphasis
Defining Measurements Full Width Half Max (FWHM): the width of the absorption line at half it’s maximum value. Changes in FWHM indicate velocity variations which relates to the temperature and composition of disk.
Defining Measurements Velocity: Measure the central wavelength to determine if object is moving toward or away from you and at what relative velocity.
Gather and Organize Data • Small portion of data.
Interpret Results “If I knew what I was looking for this would be much easier.”
Educational Lessons Learned • Student motivation more important than math/science literacy • IRAF hard to get on high school computers • Teacher collaboration helpful • Lots of support for astronomy education: NITARP, AAVSO, Lift Off, Project Astro, etc.
Research Results Variation in absorption of various elements Indicative of varying density of the disk Possible Ring Structure
V-band light curve Eqw minimum Eqw maximum Leadbeater/Stencel plateaus
Possible Ring Structure • Measure the days of a min or max • Find fraction of orbit this represents: width of ring = min or max days/(27.1 * 365) • Represent fraction angle (* 360) • Knowing the radius 18.1 AU, use small angle approximation (sin or tan) to find ring width 18.1 AU Fraction of orbit = (20 days ) *360 (27.1*365) = 0.73 Ring Width = tan 0.73 * 18.1 = 0.23 AU
Possible Ring Structure Ring mins and maxs are roughly 0.2 AU
Possible Ring Structure 1990 –S. Ferluga: disk is actually a series of concentric rings with gaps between them (like rings of Saturn) Our result predict an outer ring at a radius of 3.3AU, a wider ring with radius 2.8 AU, and two small inner rings with a radius near 1.5 AU. These two small rings may represent the one inner ring. Our results are similar to Ferluga’s prediction. Ferluga (1990, A&A, 238, 270)
What next? • Take data 2 or more times every week • Examine the spectra for more information: • H alpha emission and absorption components • Changing molecular bands (CN, CH) • FWHM interpretation