Analysis of Kakugo Content and Survival Rates in Experimental Models Over Time
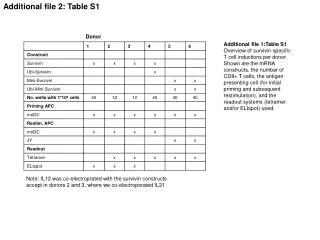
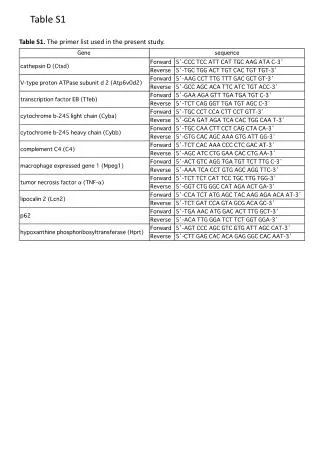
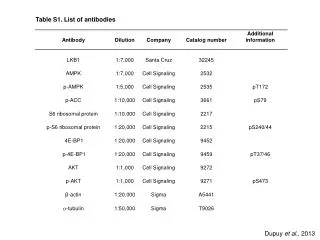
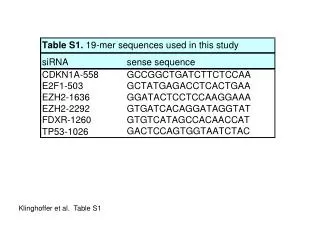
This study investigates the relative Kakugo content and survival rates across different experimental conditions over a 14-day period. We examine brain samples from infected and uninfected subjects, assessing the impact of treatment variables represented in Figure S1 and S2. The results, illustrated in Figures S3 to S6, demonstrate significant changes in expression levels and survival rates, highlighting the effects of the KV treatment on Kakugo content and overall brain health. This research provides insights into the neurobiological responses to infection and treatment protocols.

Analysis of Kakugo Content and Survival Rates in Experimental Models Over Time
E N D
Presentation Transcript
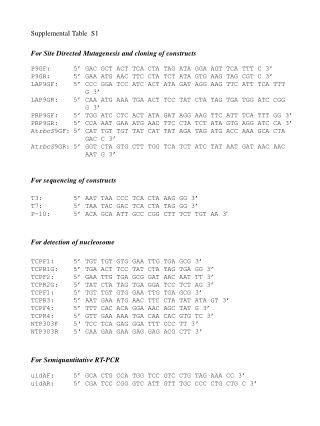
B A B E F anterior C E posterior F (Figure S1) ON lCa lCa m lo SOG PB C D E D lCa CC Pe CC
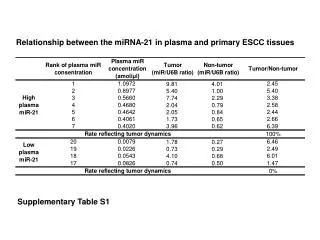
1.E+02 1.E+01 1.E+00 1.E-01 Relative Kakugo content 1.E-02 1.E-03 1.E-04 days 0 1 4 6 9 14 (4) (3) (3) (3) (3) (3) A 120 (Figure S2) 100 80 Survival rate (%) 60 40 20 0 0 1 2 3 4 5 6 7 8 9 days B
A ON lCa CB lCa m lo OC OES D lo m SOG C mCa mCa lCa lCa m CB lo lo OES ON m MB MB CB SOG lCa lCa lo lo m CB m lo AL OES AL lo m SOG B (Figure S3)
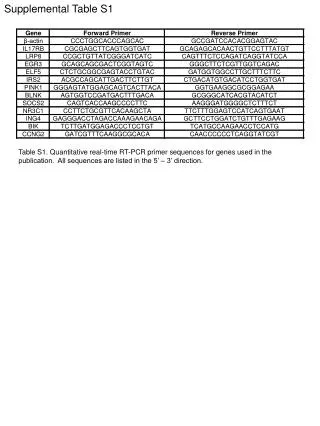
KV PBS actin P N KV DWV SBV ABPV KV + + - - actin P N DWV SBV ABPV PBS (-) F (+) A actin KV P N DWV SBV ABPV A (Figure. S4) B C D
(Figure. S5) Uninfected brains Kakugo GB10708 KV infected brains
(Figure S6) 101 100 10-1 Relative expression level of GB10708 10-2 10-3 10-4 days 0 1 4 6 9 14 N (KV) (4) (3) (3) (2) (3) (3) N (PBS) (3) (2) (3) (1) (3) (3) N (NI) (5) (2) (3) (2) (3) (4)