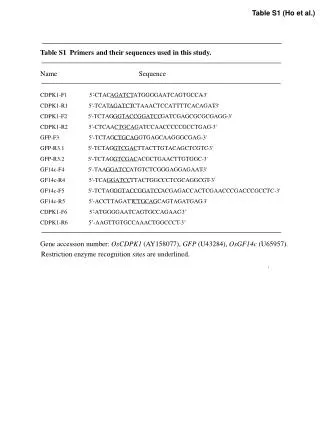
Altered NNK Metabolism in Akt2-deficient Mice - Study on Lung and Liver Microsomes
70 likes | 139 Vues
Investigating the impact of Akt2 deficiency on NNK metabolism in lung and liver microsomes of mice. Results show reduced O6-mG adduct formation in Akt2-/- mice compared to Akt2+/+. Includes in vitro metabolism data and protein analysis.

Altered NNK Metabolism in Akt2-deficient Mice - Study on Lung and Liver Microsomes
E N D
Presentation Transcript
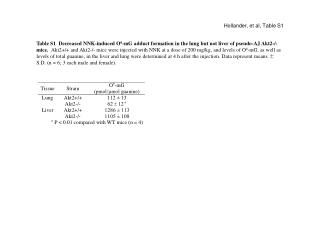
Hollander, et al, Table S1 Table S1 Decreased NNK-induced O6-mG adduct formation in the lung but not liver of pseudo-AJ Akt2-/- mice. Akt2+/+ and Akt2-/- mice were injected with NNK at a dose of 200 mg/kg, and levels of O6-mG, as well as levels of total guanine, in the liver and lung were determined at 4 h after the injection. Data represent means ± S.D. (n = 6; 3 each male and female).
Hollander, et al, Table S2 Table S2 In vitro metabolism of NNK by lung and liver microsomes from Akt2+/+, Akt2+/- and Akt2-/- mice in a pure A/J background. Rate of formation of three major NNK metabolites (HPB, NNK-N-oxide, and sodium bisulfite-trapped OPB) were determined. Reaction mixtures contained 100 mM potassium phosphate buffer, pH 7.4, 10 µM NNK, 0.20 mg/ml lung or liver microsomal protein from three strains of mice (3 each male and female), 5 mM sodium bisulfite, and 1.0 mM NADPH. The values presented are means ±S.D. (n = 6).
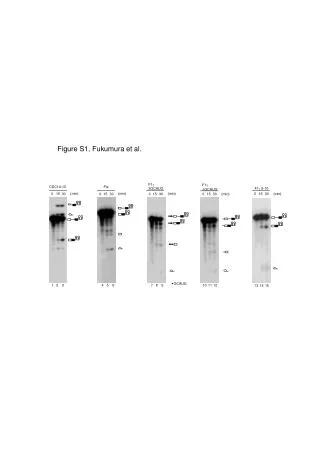
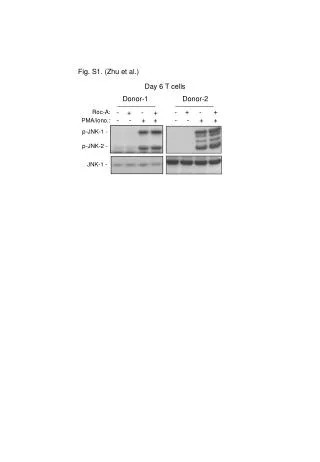
Hollander, et al, Figure S1 CYP2A CYP2A Lung Liver Calnexin Calnexin Male Female Akt+/+ Akt+/- Akt-/- Akt+/+ Akt+/- Akt-/- Figure S1 Equal CYP2A protein in lung and liver microsomes from pure A/J mice Akt2+/+ and Akt2-/- mice . Lung (5 µg protein) and liver (1 µg protein) microsomes pooled from 3 mice of each strain were analyzed (same samples as used for table S2). Densitometry analysis indicated that maximal difference in band intensity among the three strains is less than 5% of the averaged values for either liver or lung.
Hollander, et al, Table S3 Table S3 Decreased NNK-induced O6-mG adduct formation in the lung but not liver of Akt2-/- and Akt2+/- mice in a pure A/J mice bakcground. Akt2+/+, Akt2+/- and Akt2-/- mice were injected with NNK at a dose of 100 mg/kg, and levels of O6-mG, as well as levels of total guanine, in the liver and lung were determined at 4 h after the injection. Data represent means ±S.D. (n = 6; 3 each male and female).
Table S4 In vitro metabolism of NNK by lung and liver microsomes of A/J and 129/Sv mice Rate of formation of three major NNK metabolites (HPB, NNK-N-oxide, and sodium bisulfite-trapped OPB) were determined. Reaction mixtures contained 100 mM potassium phosphate buffer, pH 7.4, 10 µM NNK, 0.20 mg/ml lung and liver microsomal protein from two strains of mice, 5 mM sodium bisulfite, and 1.0 mM NADPH. The values presented are means ± S.D. (n = 3). Hollander, et al, Table S4
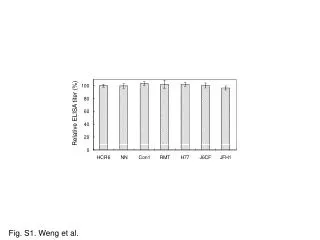
Hollander, et al, Figure S2 Figure S2 Decreased urethane-induced lung tumor multiplicity in Akt2-/- in a A/J-N8 background. 6 week old mice were injected with 1 mg/kg urethane, intraperitoneally. Lungs were harvested 16 weeks after treatment. Each point represents one mouse.
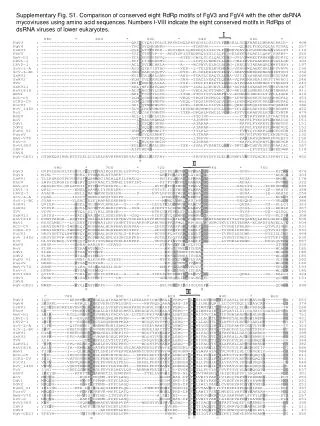
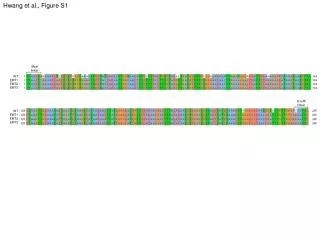
Hollander, et al, Figure S3 A/J CYP2A5 129 CYP2A5 CYP2A6 CYP2A13 Figure S3 Alignment of mouse CYP2A5 (A/J and 129 strains) and human CYP2A6 and CYP2A13. Shading indicates amino acid identity. Numbers at the top denote amino acid position within the protein. Red arrow indicates amino acid 117. The A/J CYP2A5 (117A) is similar to human CYP2A13 (117A), while the 129 CYP2A5 (117V) is similar to the human CYP2A6 (117V).