Download
1 / 7
80 likes | 251 Vues
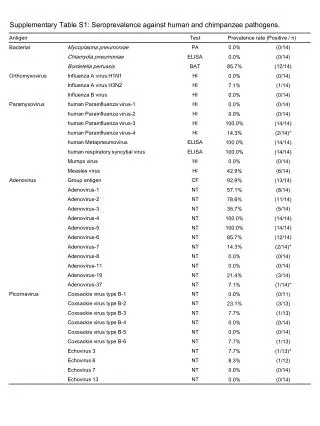
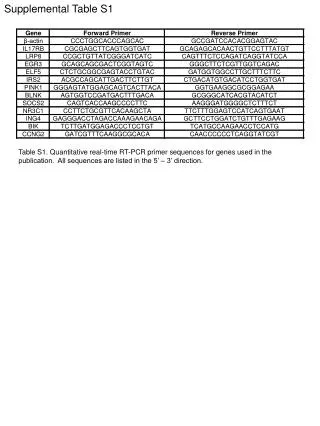
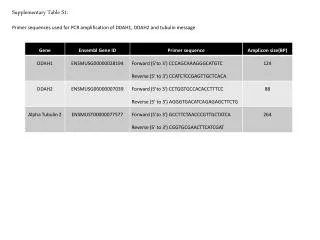
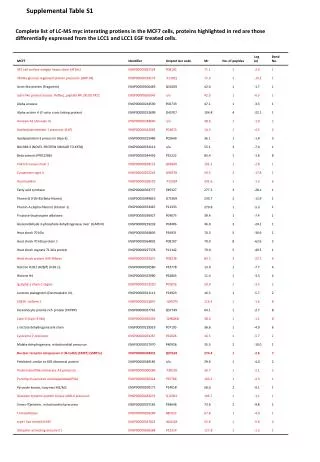
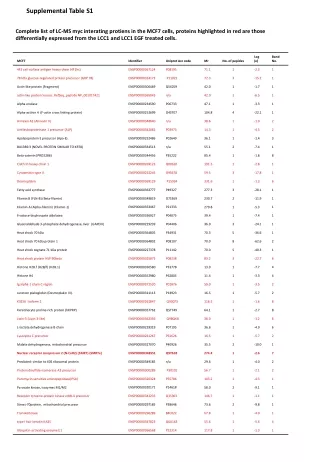
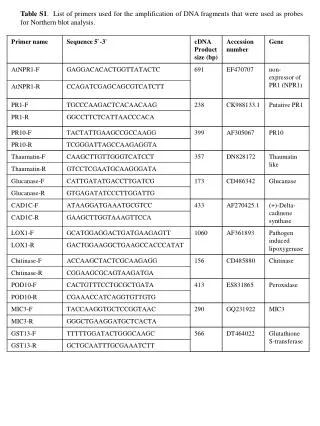
Table S1 . List of primers used for the amplification of DNA fragments that were used as probes for Northern blot analysis. Table S1 . (Continued).

E N D
Table S1. List of primers used for the amplification of DNA fragments that were used as probes for Northern blot analysis.
Fig. S1. Disease severity in wild-type (WT) and transgenic cotton plants expressing AtNPR1 gene, one month following inoculation with Thielaviopsis basicola. The image shown is at the termination of experiment #2 conducted under growth chamber conditions.
** Fig. S2. Resistance to Thielaviopsis basicola in transgenic cotton lines (#68L-19, #68L-20, and #68L-5) expressing AtNPR1. WT: wild-type. Shoot weight was used as a parameter to score disease-severity in experiment #2, conducted under growth chamber conditions, one month following inoculation with the pathogen. Data represent mean±SE, **P<0.01; n=10.
** * * Fig. S3. Resistance to Thielaviopsis basicola in transgenic cotton lines (#68L-19, #68L-20, and #68L-5) expressing AtNPR1. WT: wild-type. Root weight was used as a parameter to score disease-severity in experiment #2, conducted under growth chamber conditions, one month following inoculation with the pathogen. Data represent mean±SE, *P<0.05, **P<0.01; n=10.
*** * *** Fig. S4. Resistance to Thielaviopsis basicola in transgenic cotton lines (#68L-19, #68L-20, and #68L-5) expressing AtNPR1. WT: wild-type. Chlamydospore count was obtained from the roots of WT and transgenic cotton plants, one month following inoculation with the pathogen in experiment # 2. Data represent mean±SE; *P<0.05, ***P<0.001; n=3; each replicate is a representative sample obtained from roots pooled from 3-4 infected plants.
WT 68L-20 WT 68L-20 Uninfected Infected Fig. S5. Stunting of growth caused by Thielaviopsis basicola in wild-type (WT) and transgenic cotton plants expressing AtNPR1 gene. The image depicted is of plants three months following inoculation with the pathogen from experiment #4 conducted under greenhouse conditions.