Download
1 / 21
240 likes | 861 Vues
Lines Of Best Fit. Scatter plots are graphs where data is displayed. A general shape will usually present itself and we can determine the function associated with the data. Lines Of Best Fit. Lines Of Best Fit. I sketched a line that goes through the “center” of the data. Lines Of Best Fit.

E N D
Lines Of Best Fit Scatter plots are graphs where data is displayed. A general shape will usually present itself and we can determine the function associated with the data.
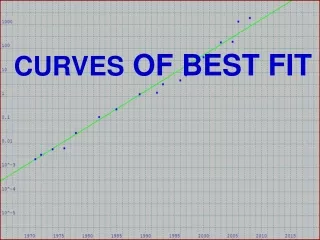
Lines Of Best Fit I sketched a line that goes through the “center” of the data.
Lines Of Best Fit In some cases, you will be given the scatter plot and will need to determine the equation of the scatter plot.
Lines Of Best Fit In some cases, you will be given the scatter plot and will need to determine the equation of the scatter plot. Find the equation of the scatter plot given below.
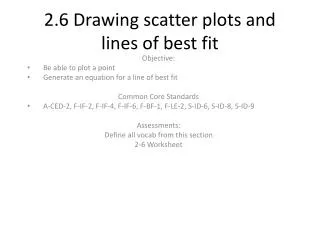
Lines Of Best Fit In some cases, you will be given the scatter plot and will need to determine the equation of the scatter plot. Find the equation of the scatter plot given below. STEPS : 1. Find the slope of the given line
Lines Of Best Fit In some cases, you will be given the scatter plot and will need to determine the equation of the scatter plot. Find the equation of the scatter plot given below. STEPS : 1. Find the slope of the given line Let’s locate 2 points ON THE LINE and determine the slope between those 2 points…
Lines Of Best Fit In some cases, you will be given the scatter plot and will need to determine the equation of the scatter plot. Find the equation of the scatter plot given below. STEPS : 1. Find the slope of the given line
Lines Of Best Fit In some cases, you will be given the scatter plot and will need to determine the equation of the scatter plot. Find the equation of the scatter plot given below. • STEPS : • Find the slope of the given line • Find the y - intercept
Lines Of Best Fit In some cases, you will be given the scatter plot and will need to determine the equation of the scatter plot. Find the equation of the scatter plot given below. • STEPS : • Find the slope of the given line • Find the y – intercept • You can either read the y – intercept from the graph or solve it algebraically if the graph doesn’t extend all the way to the y – axis…
Lines Of Best Fit In some cases, you will be given the scatter plot and will need to determine the equation of the scatter plot. Find the equation of the scatter plot given below.
Lines Of Best Fit In some cases, you will be given the scatter plot and will need to determine the equation of the scatter plot. Find the equation of the scatter plot given below.
Lines Of Best Fit In some cases, you will be given the scatter plot and will need to determine the equation of the scatter plot. Find the equation of the scatter plot given below.
Lines Of Best Fit In some cases, you will be given the scatter plot and will need to determine the equation of the scatter plot. Find the equation of the scatter plot given below.