Download
1 / 64
640 likes | 660 Vues
Explore using real data to create mathematical models, focusing on exponential growth and decay. Learn to analyze data, draw lines of best fit, and utilize regression tools. Apply this in Math 8 and 9 to strengthen problem-solving skills and mathematical literacy.

E N D
USING REAL DATA TO ILLUSTRATE THE BEHAVIOUR OF FUNCTIONS, NOTABLY EXPONENTIAL GROWTH AND DECAY, AND TO CREATE MATHEMATICAL MODELS FOR THE PURPOSES OF INTERPOLATION AND EXTRAPOLATION.
THE TOOLS: • Plotting data manually and drawing a line of best fit or sketching a curve of best fit. • Graphing Calculator to plot and use regression tools to create mathematical models. • Graphing/spreadsheet programs which can provide regression analysis.
MATH 8 and 9 The Mathematics 8 and 9 curriculum is meant to reinforce the main goals of mathematics education: • using mathematics confidently to solve problems • using mathematics to better understand the world around us • communicating and reasoning mathematically • appreciating and valuing mathematics • making connections between mathematics and its applications • committing themselves to lifelong learning • becoming mathematically literate and using mathematics to participate in, and contribute to, society
MATH 8 • Patterns B1 graph and analyse two-variable linear relations
MATH 9 • PATTERNS B2 graph linear relations, analyse the graph, and interpolate or extrapolate to solve problems • DATA ANALYSIS D3 develop and implement a project plan for the collection, display, and analysis of data by - formulating a question for investigation - selecting a population or a sample - collecting the data - displaying the collected data in an appropriate manner - drawing conclusions to answer the question
PRECALCULUS 12RELATIONS AND FUNCTIONS 12. Graph and analyze polynomial functions (limited to polynomial functions of degree 5). • 12.7 Solve a problem by modelling a given situation with a polynomial function and analyzing the graph of the function.
Foundations of Mathematics and Pre-calculus (Grade 10) Relations and Functions Specific Outcomes 1. Interpret and explain the relationships among data, graphs and situations. 1.1 Graph, with or without technology, a set of data, and determine the restrictions on the domain and range. 1.2 Explain why data points should or should not be connected on the graph for a situation. 1.3 Describe a possible situation for a given graph. 1.4 Sketch a possible graph for a given situation. 1.5 Determine, and express in a variety of ways, the domain and range of a graph, a set of ordered pairs or a table of values.
Apprenticeship and Workplace Mathematics (Grade 11) Statistics Develop statistical reasoning. 1. Solve problems that involve creating and interpreting graphs, including: bar graphs, histograms, line graphs, circle graphs. 1.1 Determine the possible graphs that can be used to represent a given data set, and explain the advantages and disadvantages of each. 1.2 Create, with and without technology, a graph to represent a given data set. 1.3 Describe the trends in the graph of a given data set. 1.4 Interpolate and extrapolate values from a given graph. 1.7 Solve a contextual problem that involves the interpretation of a graph.
FOUNDATIONS OF MATHEMATICS 12 1. Represent data, using polynomial functions 1.4 Graph data and determine the polynomial function that best approximates the data. 1.5 Interpret the graph of a polynomial function that models a situation, and explain the reasoning. 1.6 Solve, using technology, a contextual problem that involves data that is best represented by graphs of polynomial functions, and explain the reasoning.
FOUNDATIONS OF MATHEMATICS 12 2. Represent data, using exponential and logarithmic functions, to solve problems. 2.4 Graph data and determine the exponential or logarithmic function that best approximates the data. 2.5 Interpret the graph of an exponential or logarithmic function that models a situation, and explain the reasoning. 2.6 Solve, using technology, a contextual problem that involves data that is best represented by graphs of exponential or logarithmic functions, and explain the reasoning.
FOUNDATIONS OF MATHEMATICS 12 Mathematics Research Project 1. Research and give a presentation on a current event or an area of interest that involves mathematics. 1.1 Collect primary or secondary data (statistical or informational) related to the topic. 1.2 Assess the accuracy, reliability and relevance of the primary or secondary data collected by: -identifying examples of bias and points of view -identifying and describing the data collection methods -determining if the data is relevant -determining if the data is consistent with information obtained from other sources on the same topic. 1.3 Interpret data, using statistical methods if applicable. 1.5 Organize and present the research project, with or without technology.
PRECALCULUS 12RELATIONS AND FUNCTIONS 10. Solve problems that involve exponential and logarithmic equations. 10.5 Solve a problem that involves exponential growth or decay. 10.7 Solve a problem that involves logarithmic scales, such as the Richter scale and the pH scale. 10.8 Solve a problem by modelling a situation with an exponential or a logarithmic equation.
BETTER QUESTION: HOW CAN WE PROVIDE INTERESTING AND MEANINGFUL EXTENSIONS, ESPECIALLY IN THE AREA OF FUNCTIONS AND THEIR APPLICATIONS?
“An increasing emphasis on visualization, primarily in the area of the graphical representation of functions, is an important aspect of Grade 12 mathematics. My experiences indicate various levels of student reluctance to accept and therefore appreciate the utility of these visualizations in understanding course content and in problem-solving.”
WORLD POPULATION GROWTH FROM 1950 TO 2007 POPULATION (BILLIONS) YEAR
T H E E X P O N E N T I A L G R O W T H O F MICROPROCESSOR TECHNOLOGY • CLOCK SPEED • TRANSISTORS • MIPS
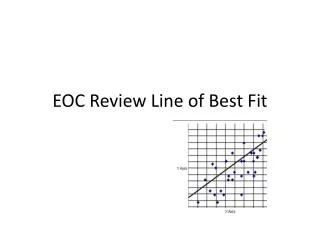
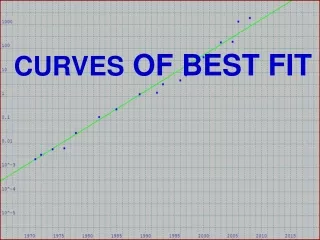
CURVE OF BEST FIT, 1971-1999 TRANSISTORS (millions) YEAR
CURVE OF BEST FIT, 1971-1999 TRANSISTORS (millions) • Moore’s Law: • predicted in 1965 that the number of transistors on a microprocessor would double every two years. Starting with 2300 transistors in 1971 on the Intel 4004 chip, … YEAR
MICROPROCESSOR TRANSISTOR GROWTH OVER TIME TRANSISTORS (millions y = exp(0.35x - 696.13) YEAR
TRANSISTORS (millions) MOORE’S LAW – LOGARITHMIC VIEW Y=0.0023(2^((x-1971)/2)) YEAR