1 / 1

Comparative Analysis of IOP Changes in Various Treatment Groups over 12 Weeks

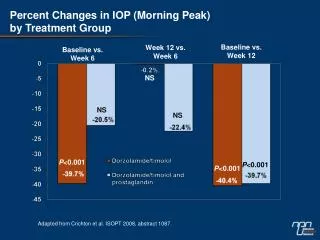
Analyzing the percentage changes in Intraocular Pressure (IOP) during morning peak hours across different treatment groups from baseline to week 12, week 12 to week 6, and baseline to week 6. The study shows statistically significant differences (P<0.001) in IOP changes. Adapted from Crichton et al., ISOPT 2008, abstract 1087.

shiloh
Télécharger la présentation

Comparative Analysis of IOP Changes in Various Treatment Groups over 12 Weeks

An Image/Link below is provided (as is) to download presentation Download Policy: Content on the Website is provided to you AS IS for your information and personal use and may not be sold / licensed / shared on other websites without getting consent from its author. Content is provided to you AS IS for your information and personal use only. Download presentation by click this link. While downloading, if for some reason you are not able to download a presentation, the publisher may have deleted the file from their server. During download, if you can't get a presentation, the file might be deleted by the publisher.

E N D

Presentation Transcript


  1. Percent Changes in IOP (Morning Peak)by Treatment Group Baseline vs. Week 12 Week 12 vs. Week 6 Baseline vs. Week 6 NS NS NS P<0.001 P<0.001 P<0.001 Adapted from Crichton et al. ISOPT 2008, abstract 1087.

More Related